

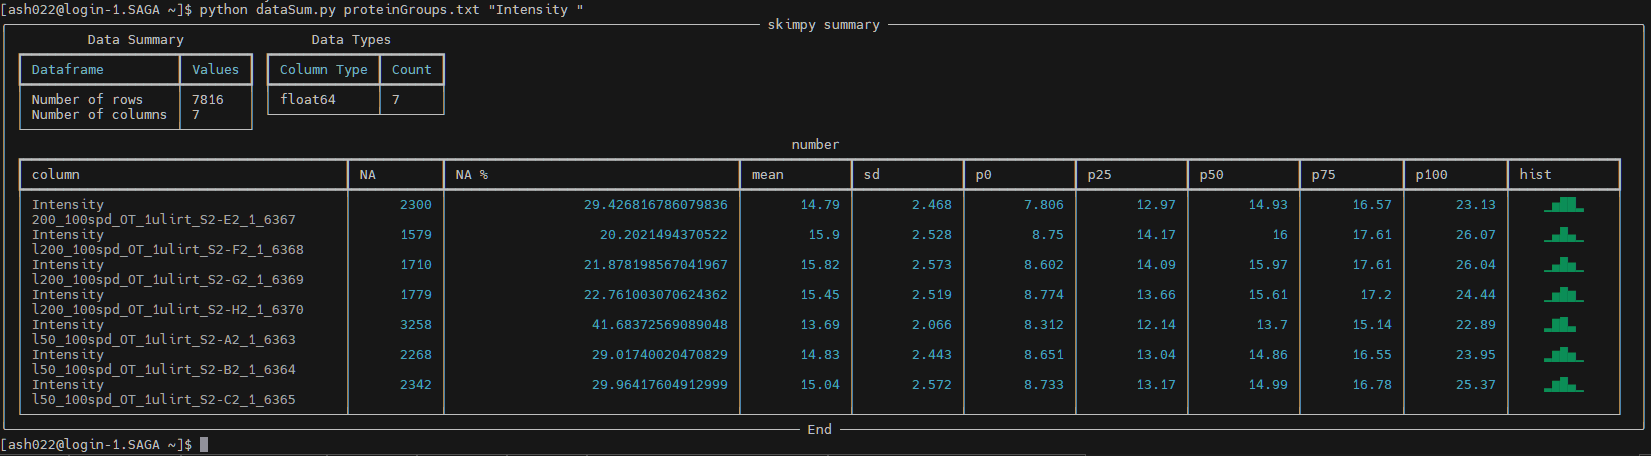
I do a lot of Proteomics data processing with MaxQuant over Linux servers provided by National e-infrastructure services so always on a lookout for some nice command line tool to quickly check the distribution of log2-Intensity values for protein-groups within the terminal and came across Coding Nexus’s post which reminded me of the xkcd message that everything is just a “pip install …” and “… import…” away 😊
pip install skimpy summarytools numpy pandas jinja2
In that spirit, just wrote dataSum.py
wget https://raw.githubusercontent.com/animesh/scripts/417d084bfefc734bdae4f8a7c99d55acefe0a184/dataSum.py
which is nothing but just a call with values to the python module skimpy using the proteinGroups.txt , for example from previous post
wget https://zenodo.org/records/14557756/files/proteinGroups.txt
and voila, quartiles and all AND even a histogram all within terminal!
python dataSum.py proteinGroups.txt "Intensity "
also writing out the report in an html
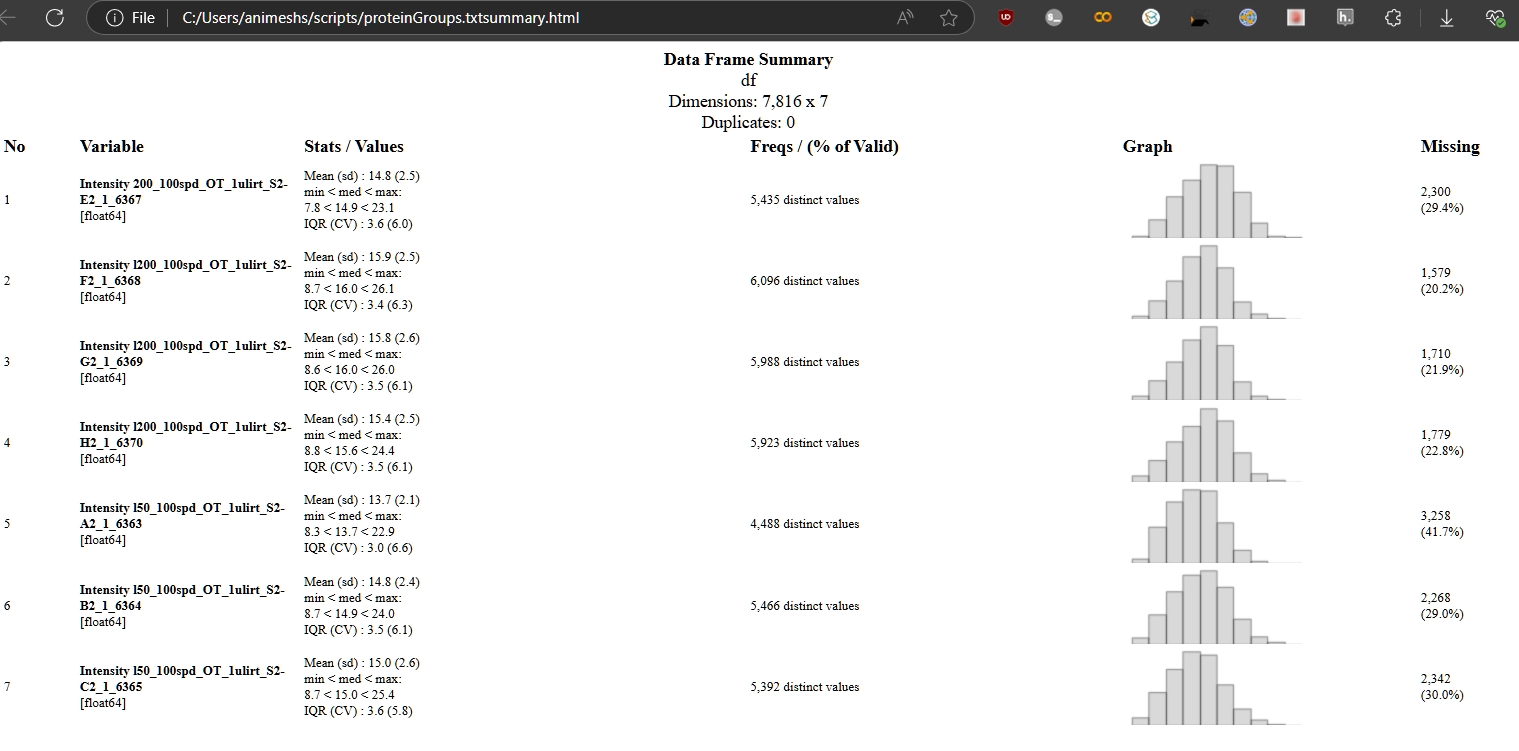
for the record, courtesy summarytools 🤓