
Multiple Myeloma Survival Analysis App
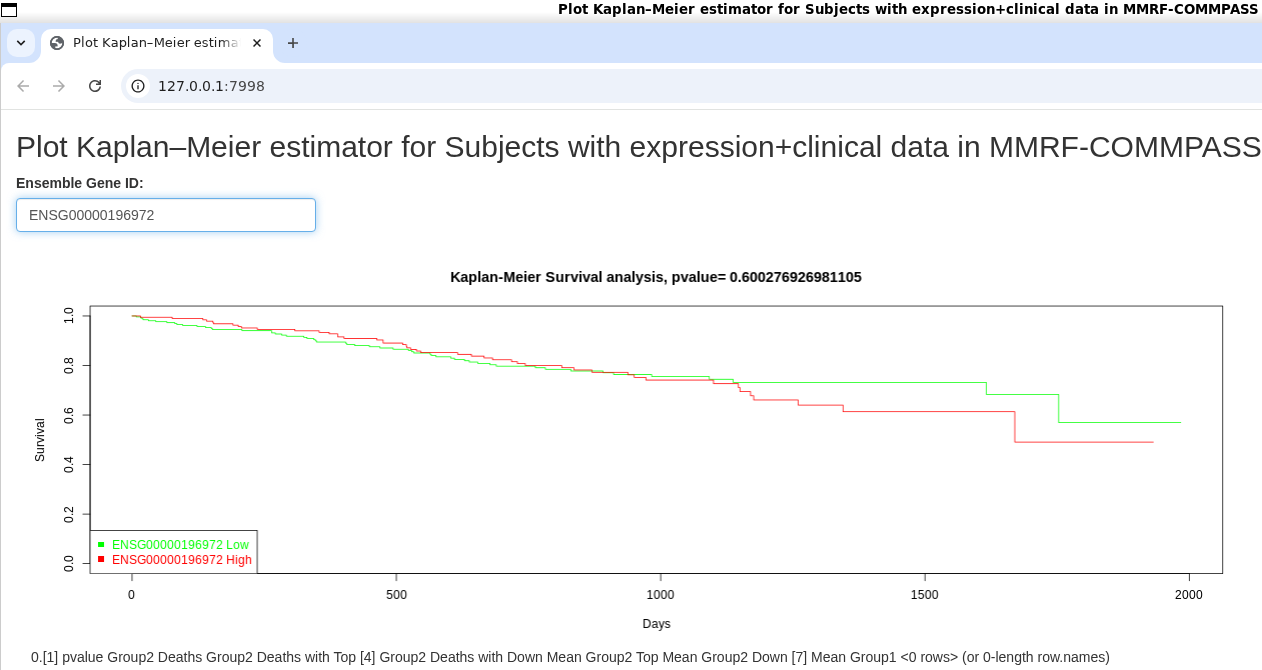
Plot Kaplan–Meier estimator for Subjects with expression+clinical data in MMRF-COMMPASS

Install R + packages, clone my repo, move into the directory containing the code, download the compiled data (creation details in the cloned repo) and run the app 🥳 For example, for an Ubuntu terminal (tested over Windows Subsystem for Linux):
sudo apt install r-base-coreR> install.packages("BiocManager")> BiocManager::install("TCGAbiolinks")> install.packages("shiny")> quit(save="no")git clone https://github.com/animesh/MMRFBiolinkscd MMRFBiolinks/plotKM/wget https://zenodo.org/records/15879036/files/MMRFdataPrepro.rdsRscript -e "shiny::runApp('app.R', launch.browser=TRUE)"
Loading required package: shiny
Warning: program compiled against libxml 210 using older 209
Listening on http://127.0.0.1:7998
Yeah, that’s pretty much it! Think this led to a better understanding of data https://www.ebi.ac.uk/pride/archive/projects/PXD006458 we started collecting way back in 2012, five years of collecting of understanding these “curves”, connecting to our data-story and finally published it all https://translational-medicine.biomedcentral.com/articles/10.1186/s12967-024-05345-x last year! Wish had know about https://www.nature.com/sdata/ 🙃
The coolest thing of being Bioinformatics professional is that most probably someone has already done the hard-work of collecting and processing data, one can truly stand over the giants and add even more clinical insights to whatever biomedical data they are working on! While working on our data coming from patients leading up to Myeloma we were looking for what is known about the impact of expression on survival. The go-to resource for this kind of data is The Cancer Genome Atlas (TCGA) which has collected clinically relevant data from many types https://gdc.cancer.gov/resources-tcga-users/tcga-code-tables/tcga-study-abbreviations of Cancer and for Myeloma there is The Relating Clinical Outcomes in Multiple Myeloma to Personal Assessment of Genetic Profile study https://gdc.cancer.gov/about-gdc/contributed-genomic-data-cancer-research/foundation-medicine/multiple-myeloma-research-foundation-mmrf (MMRF-CoMMpass) AND there is already an R-package for integrating and analyzing the data https://github.com/marziasettino/MMRFBiolinks so all i had to do was fork it and create an interactive app https://github.com/animesh/MMRFBiolinks/blob/master/plotKM/app.R which is essentially patching a specific block of the TCGAbiolinks::TCGAanalyze_SurvivalKM function to move ID to bottom-left of the plot and creating a shiny app out of it so that we all can explore the survival curves for known ensemble genes
flowchart TD
    A[Original TCGAbiolinks::TCGAanalyze_SurvivalKM] -->|Assign| B[blKM]
    B -->|Replace body[[25]][[4]]| C[Custom Survival Analysis Block]
    C -->|Used in| D[Shiny App Output]
just LOOOOOVE hacking open-source 🤓 feel free to explore hardcoded parameters and debug 😜