
Basic Differential Expression Analysis App
using simple T-test followed by Benjamini Hochberg correction (FDR).

Every time I got proteomics data (you know, those lovely proteinGroups.txt files from MaxLFQ), the first think i do is run a quick T-test over log2-normalized values, because as well know, log2-tranform can make anything look normall-ish distributed 🙃not to mention that Gosset, developer of T-test worked at the Brewery 😜 but eventually repeating same steps in Excel felt like drudgery, specially calculating the FDR,
Enter diffExpr: solution to my Laziness
diffExpr — a Shiny app that handles all the boring parts of preliminary differential expression analysis. The idea was simple: upload your proteinGroups.txt, click a few buttons, get results 🎉 Been using it for a while but never got around sharing cos it was even more clunky, now thanks to chatGPT, i think it is user friendly enough to share 🤞
What Makes It (Hopefully) Useful
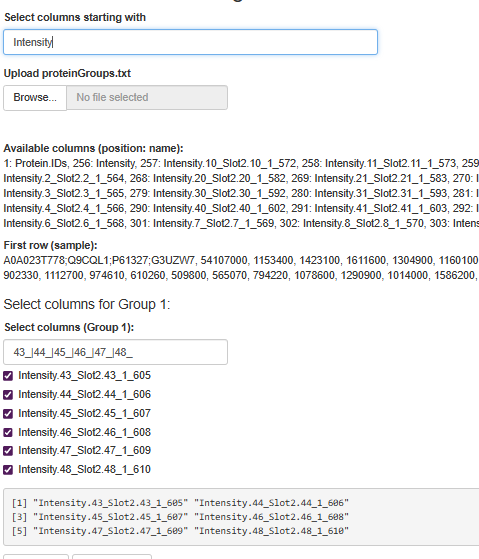
Smart Group Selection: You can use patterns like 43_|44_|45_|46_|47_|48_ to grab all columns that match. No more manually selecting 20 columns one by one. I built in some default filters because, let's be honest, we all have similar sample naming conventions.
Visual Feedback: The app shows you exactly which columns it's going to use before running the analysis. Because nothing's worse than realizing you included the wrong samples after waiting 10 minutes for results.
Statistics: Row-wise t-tests with Benjamini-Hochberg correction. The bread and butter of differential expression, implemented to handle missing-values (I hope 🤞).
Instant Visualizations: Histograms, heatmaps, and volcano plots generate automatically. The heatmap shows missing values as white, which is super helpful for spotting data quality issues at a glance.
Real-World Testing (AKA: Does This Thing Actually Work?)
I tested it with data from a breast cancer study (PXD037288 if you're curious). Comparing metastatic vs non-metastatic tumors — exactly the kind of comparison we do all the time in clinical research.
The results? They matched what I got from my manual R scripts, which was both reassuring and slightly disappointing (part of me hoped the app would find something my manual analysis missed 😅).
Three Ways to Try It
Option 1: Just Click This Link
👉 https://fuzzylife.shinyapps.io/diffExpr/
No installation, no fuss. Upload your data and go.
By default, it loads up the proteinGroups.txt from PXD037288
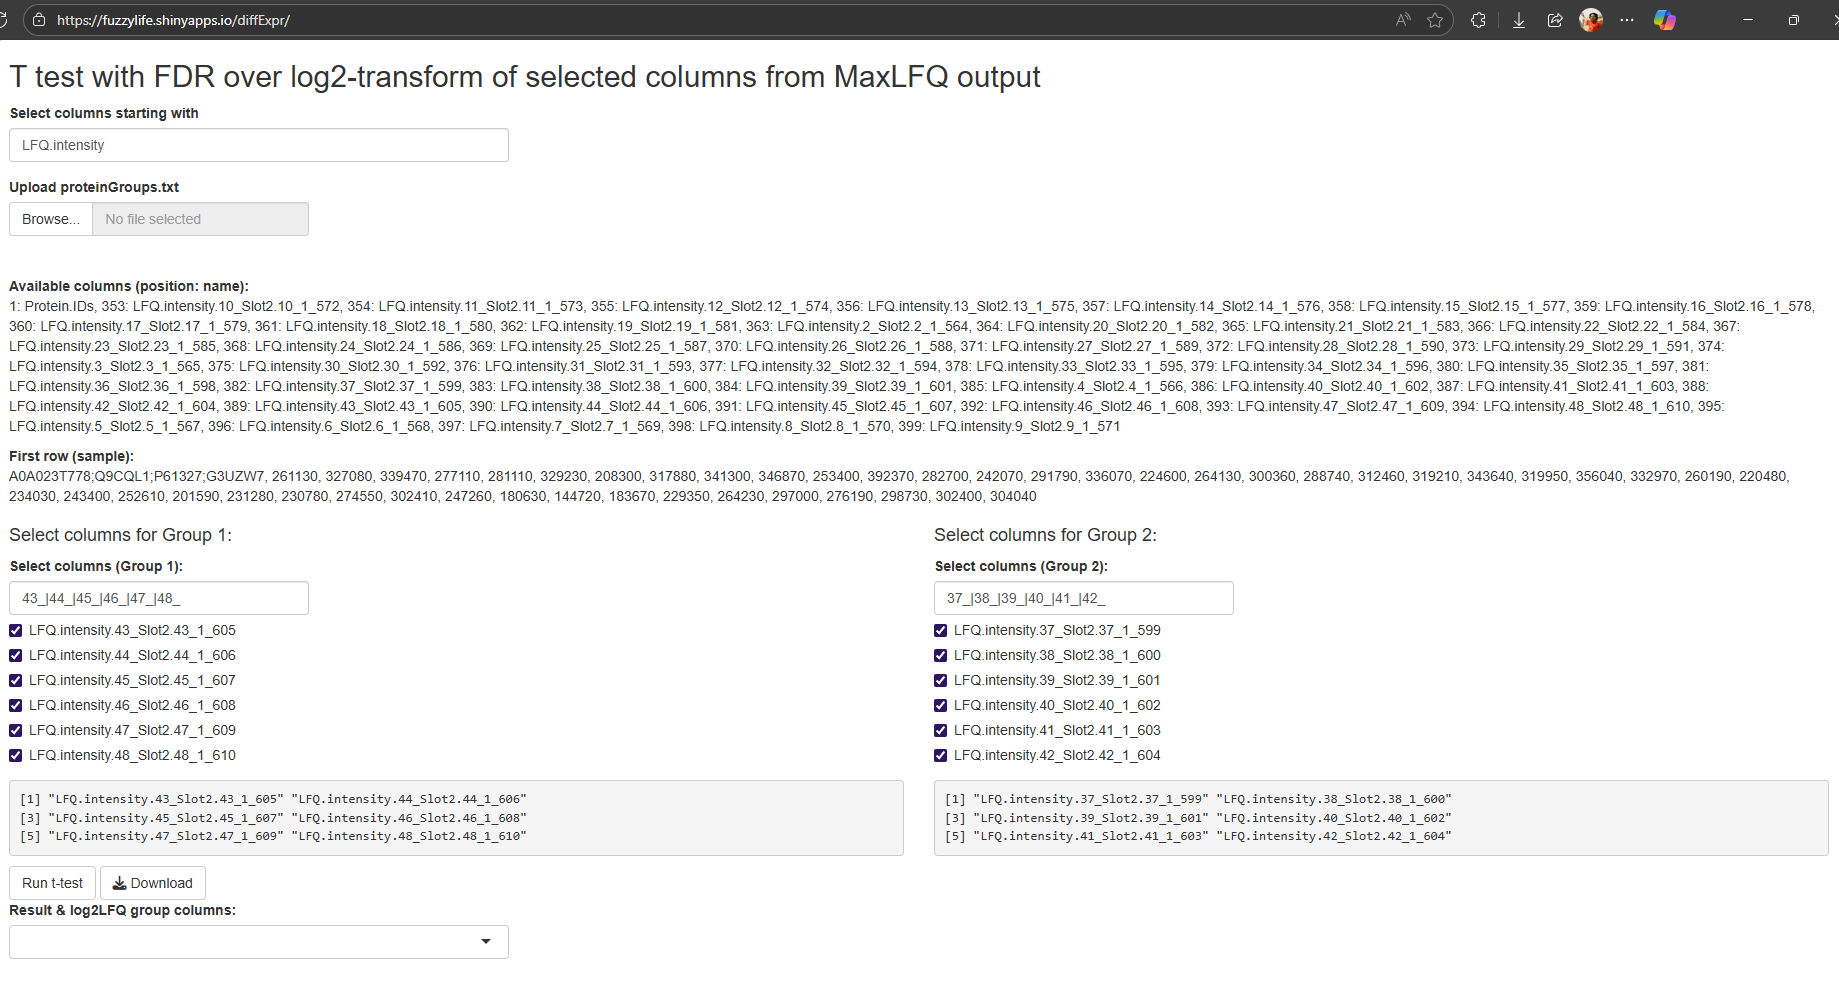
Clicking the “Run t-test” should generate the figures and “Download” should give an Excel friendly CSV 🤓
I usually play around with the drop-down and check histogram, DO check log2-sample histograms using the drop-down, like
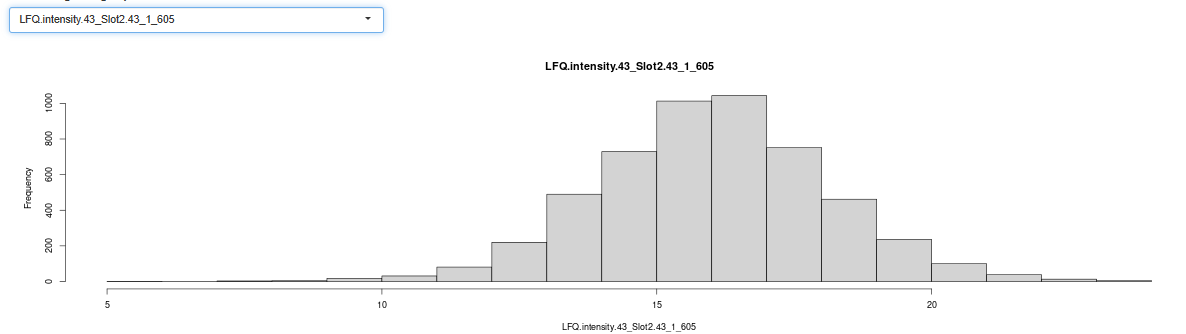
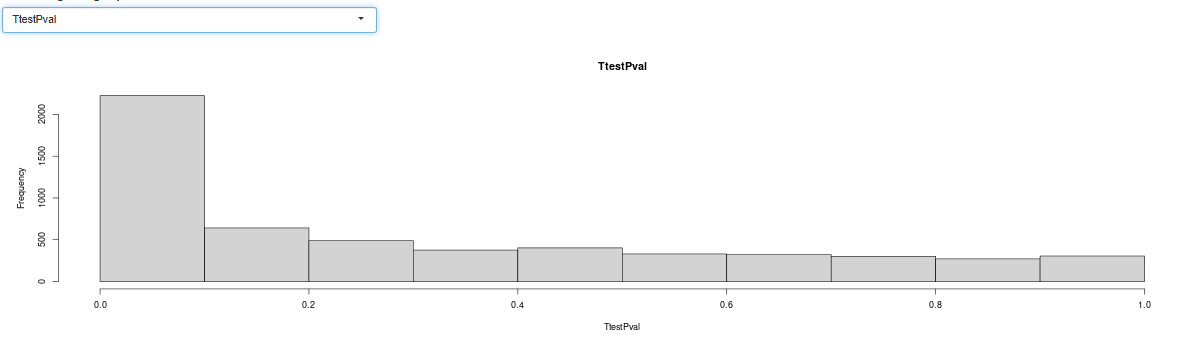
should look similar, not to mention the default T-test p-value histogram
and its corrected version
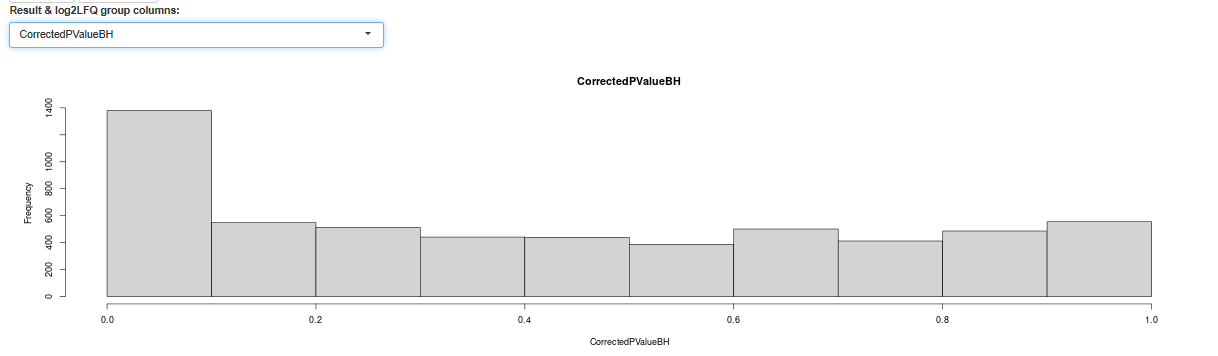
check non-zero, bins above, should be uniform-ishh
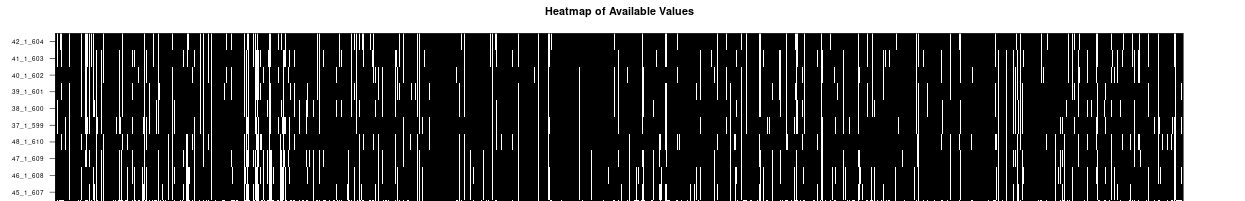
heatmap, more black than white?
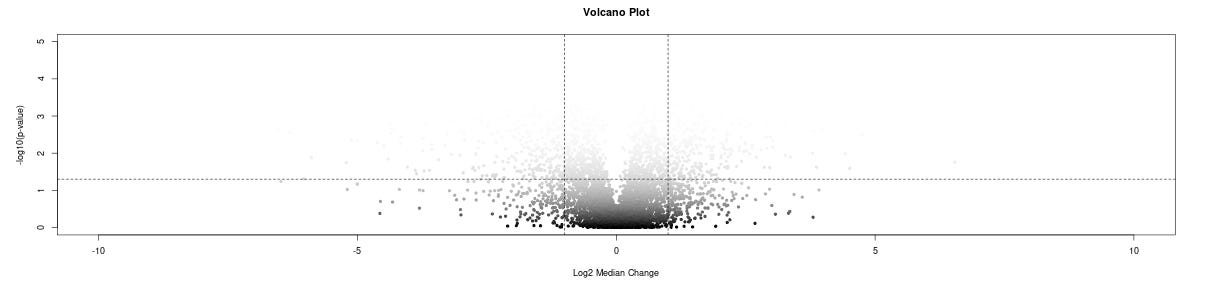
volcano-plot, symmetric around 0?
Sometime the LFQ values are messed up (like low sample, pull-down experiment?), so play with Intensities directly in such situations might give better insights, like
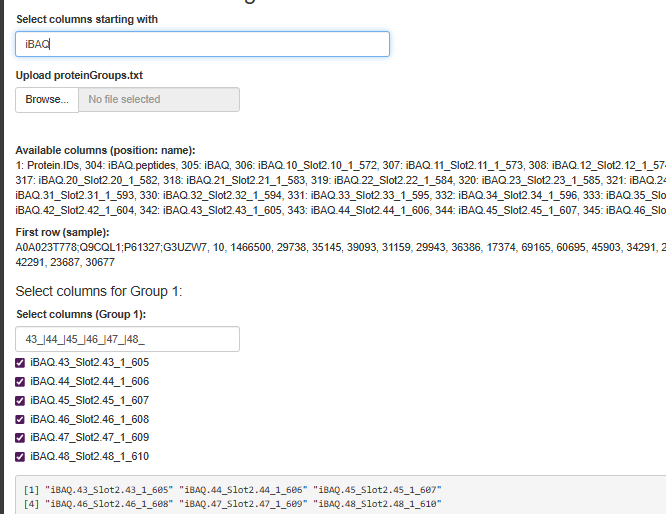
Or iBAQ, if you have?
Option 2: Run It Locally
bash
git clone https://github.com/animesh/diffExpr
cd diffExpr
Rscript -e "shiny::runApp('app.R')"
Better for large files and if you don't trust the internet with your precious data.
Option 3: Fork It and Make It Better
The code's on GitHub. Found a bug? Have a feature idea? My R skills are... evolving, so I'm sure there's room for improvement 😊
Current Limitations (AKA: Known Issues I Haven't Fixed Yet)
It's designed specifically for MaxLFQ output, so other data formats might not work perfectly
Large files can be slow on the online version
The interface could probably be prettier (UI design is not my strong suit 🤪)
Missing value handling could be more sophisticated
Variance could be stabilized …
What's Next?
I'm thinking about adding:
Support for more than two-group comparisons along with vsn
Better missing value imputation options
Integration with pathway analysis tools
Maybe some machine learning features (because everything needs ML these days, right?)
But honestly, it does what I need it to do, and scope creep is real. Sometimes "good enough" is actually good enough.
Give It a Try!
If you work with proteomics data and find yourself writing the same analysis scripts over and over, give diffExpr a shot. It might save you some time. And if you find bugs or have suggestions, drop me a line — I'm always looking for ways to make this thing more useful.
The code's all open source because, well, science should be reproducible and accessible. Plus, someone smarter than me will probably spot improvements I missed 🤓
👉 Try it online: https://fuzzylife.shinyapps.io/diffExpr/
👉 GitHub repo: https://github.com/animesh/diffExpr
P.S. - Yes, the app name is literally just "differential expression" shortened. I'm great at naming