
MaxLFQ
looking inside the "gold" standard of normalization in mass-spec proteomics

Life science is lucky to attract awesome Physical science grads like Crick, co-founder of structure of our DNA and in this case Cox, developer of MaxQuant 🙏 His MaxLFQ is bedrock of normalizing the messy mass-spec quantification values. I have used it almost since i started working with proteomics data, almost on a daily basis! I am not sure where in past we will be without such folks on the shoulders of whom we begin to see farther in future… BUT i always had this desire to see if (A)I could reverse engineer the equations



followed by scaling back to compare generated values to their benchmark dataset result using marimo 🥰 tech-stack with another “agentic” weekend?
Short answer
Yes, maxLFQmo running in browser via WASM!
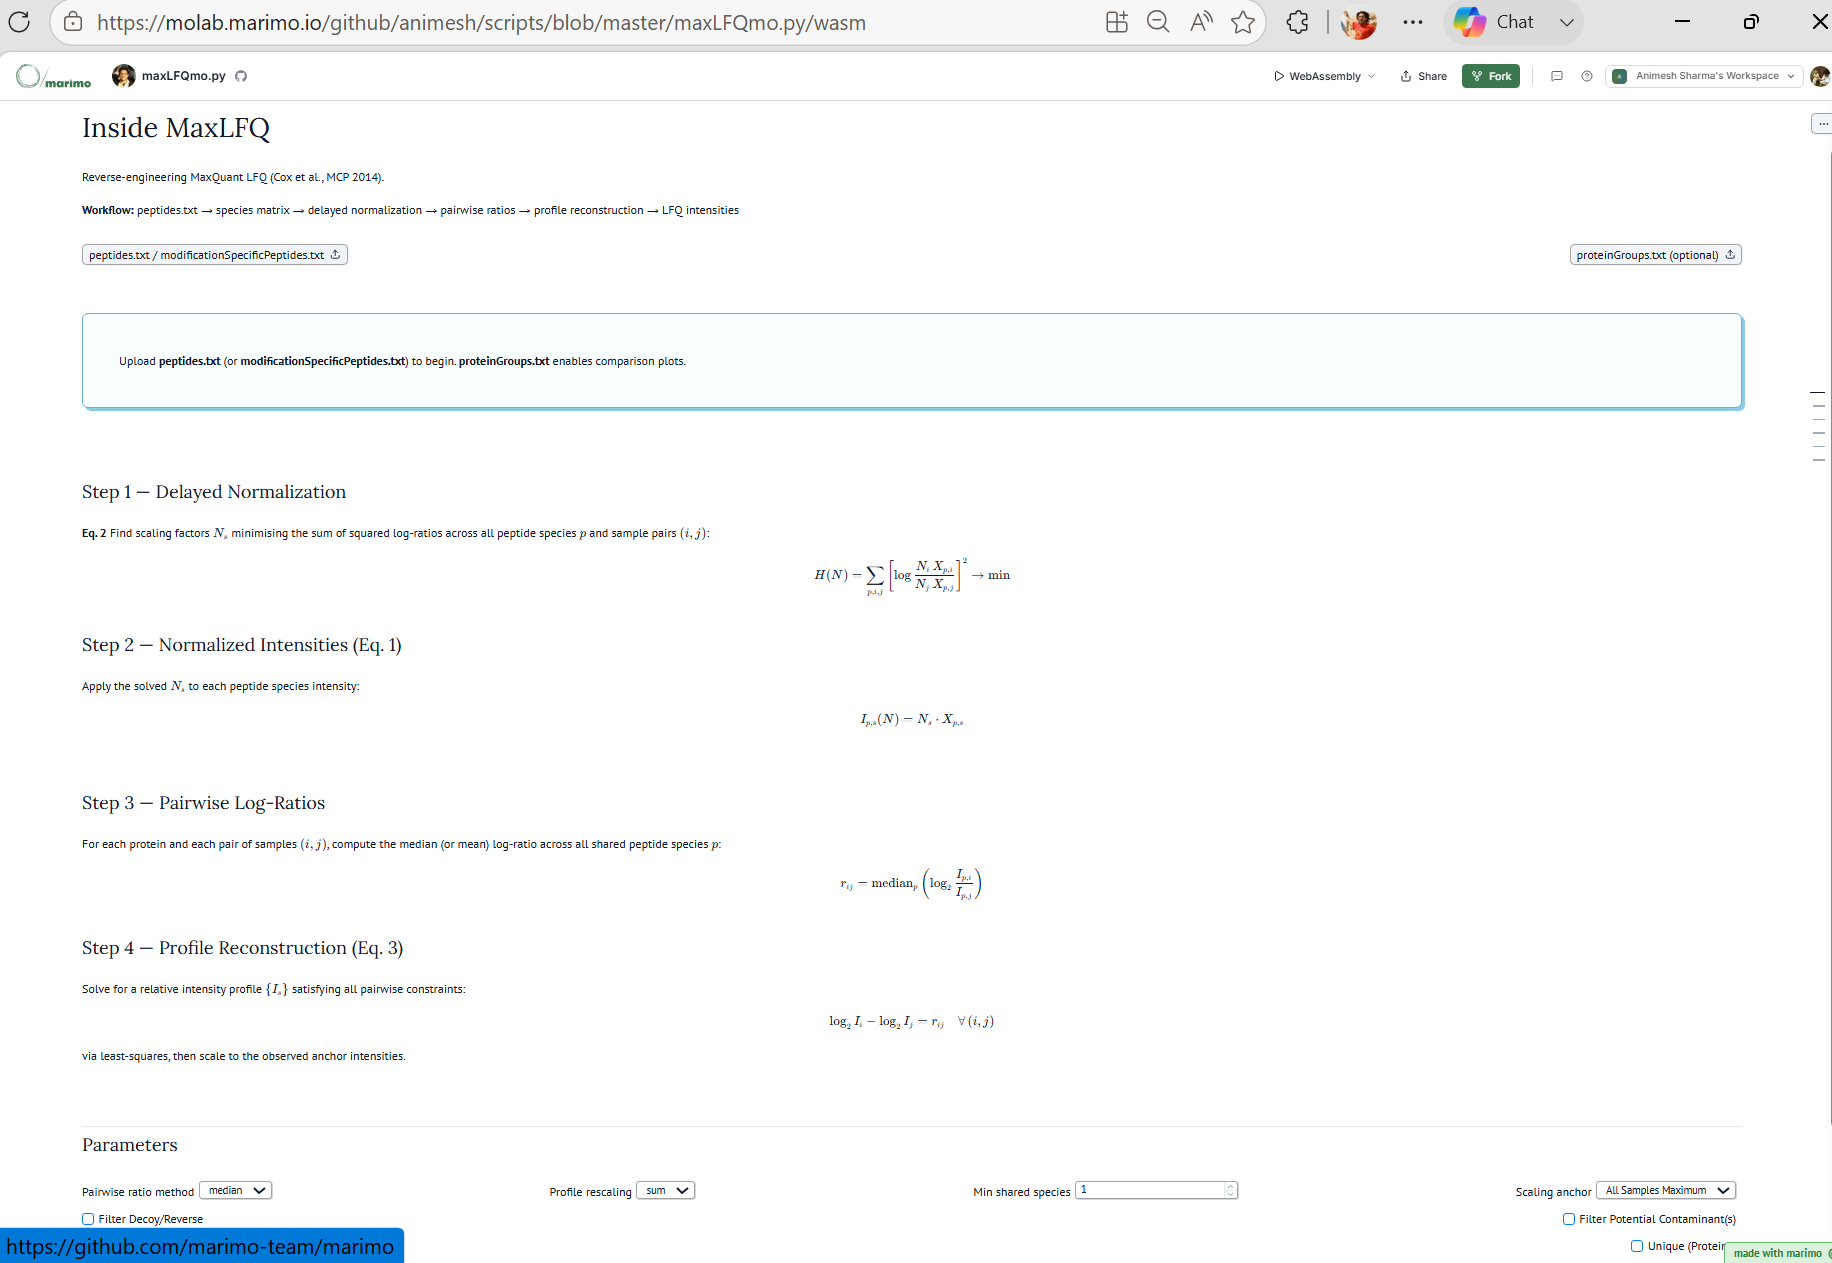
It is an Inter/reactive notebook that takes in MaxQuant peptides.txt here
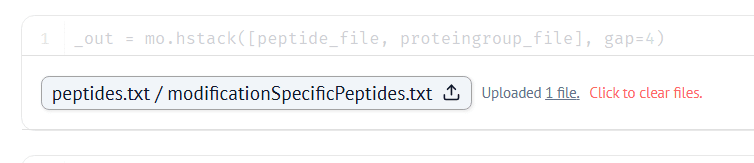
and walks through MaxLFQ with plots at every stage and downloadable LFQ table at the end 🤞
Long answer…
Almost! If you upload the corresponding MaxQuant proteinGroups.txt here

looks like there are little residuals left to address 🙃
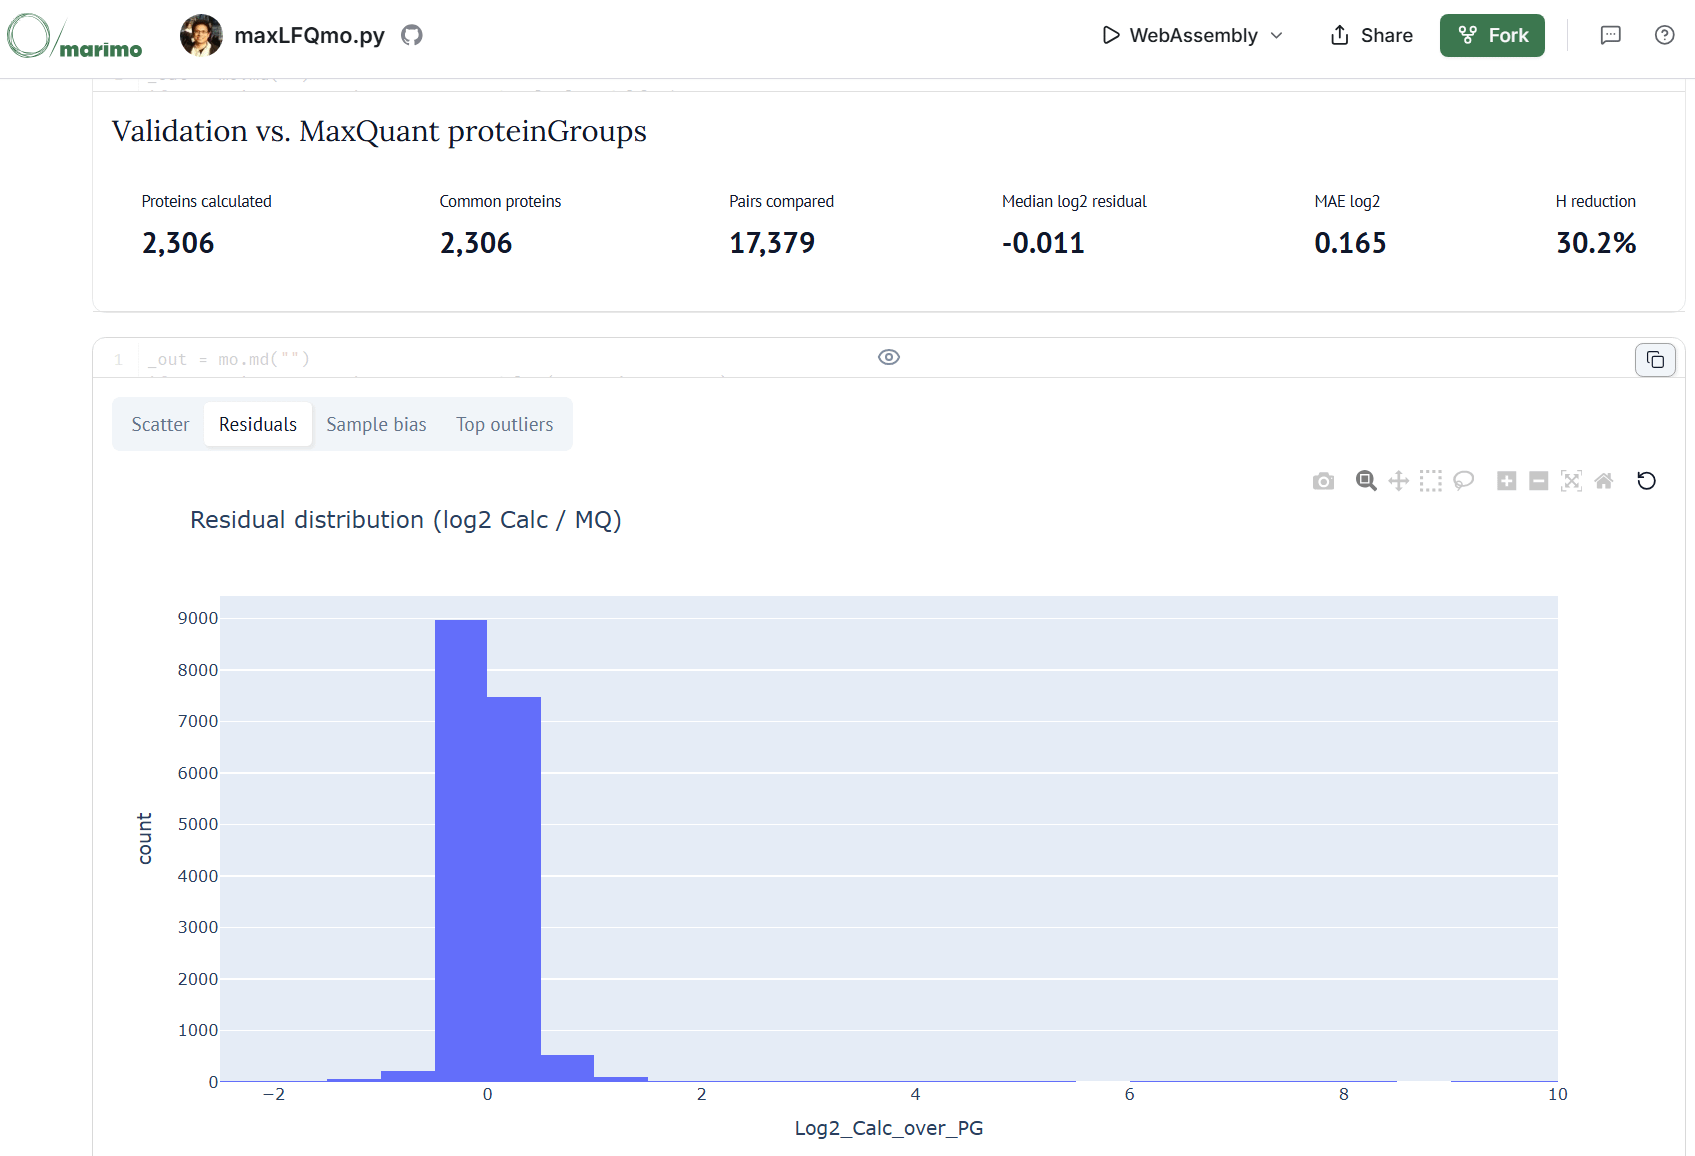
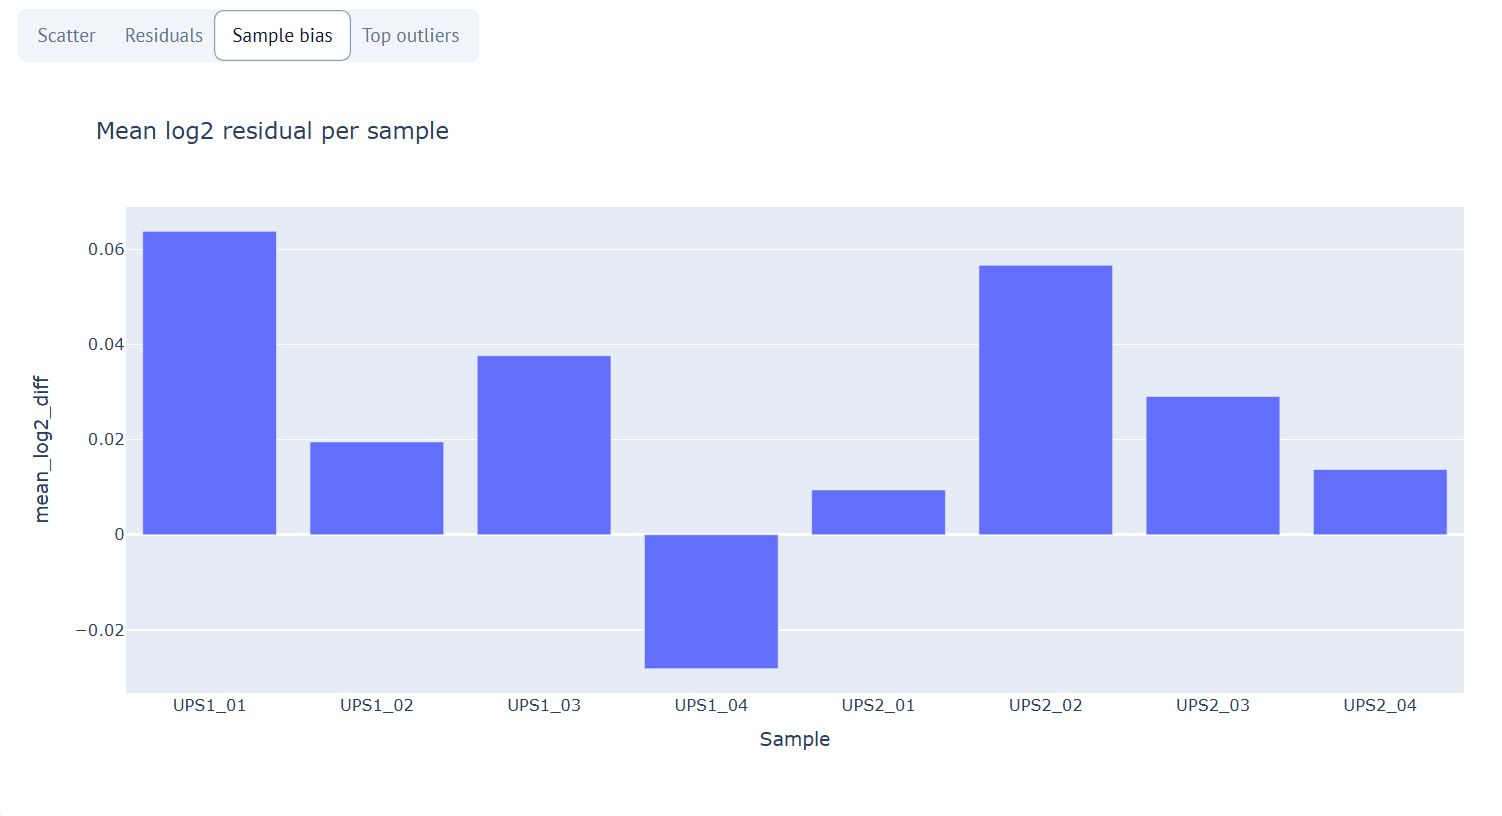
Even though “little” but something clearly is missing in the code. The way paper presents AFAIK, MaxLFQ is doing four things, those three equations mentioned and rescaling. Basically, builds a species matrix each unique peptide sequence + modification + charge combination (a "species") becomes a row, each sample a column. Here i must note that that i am using peptides.txt which has collapsed mod+charge states, The results shared has mod-specific table as well but using that
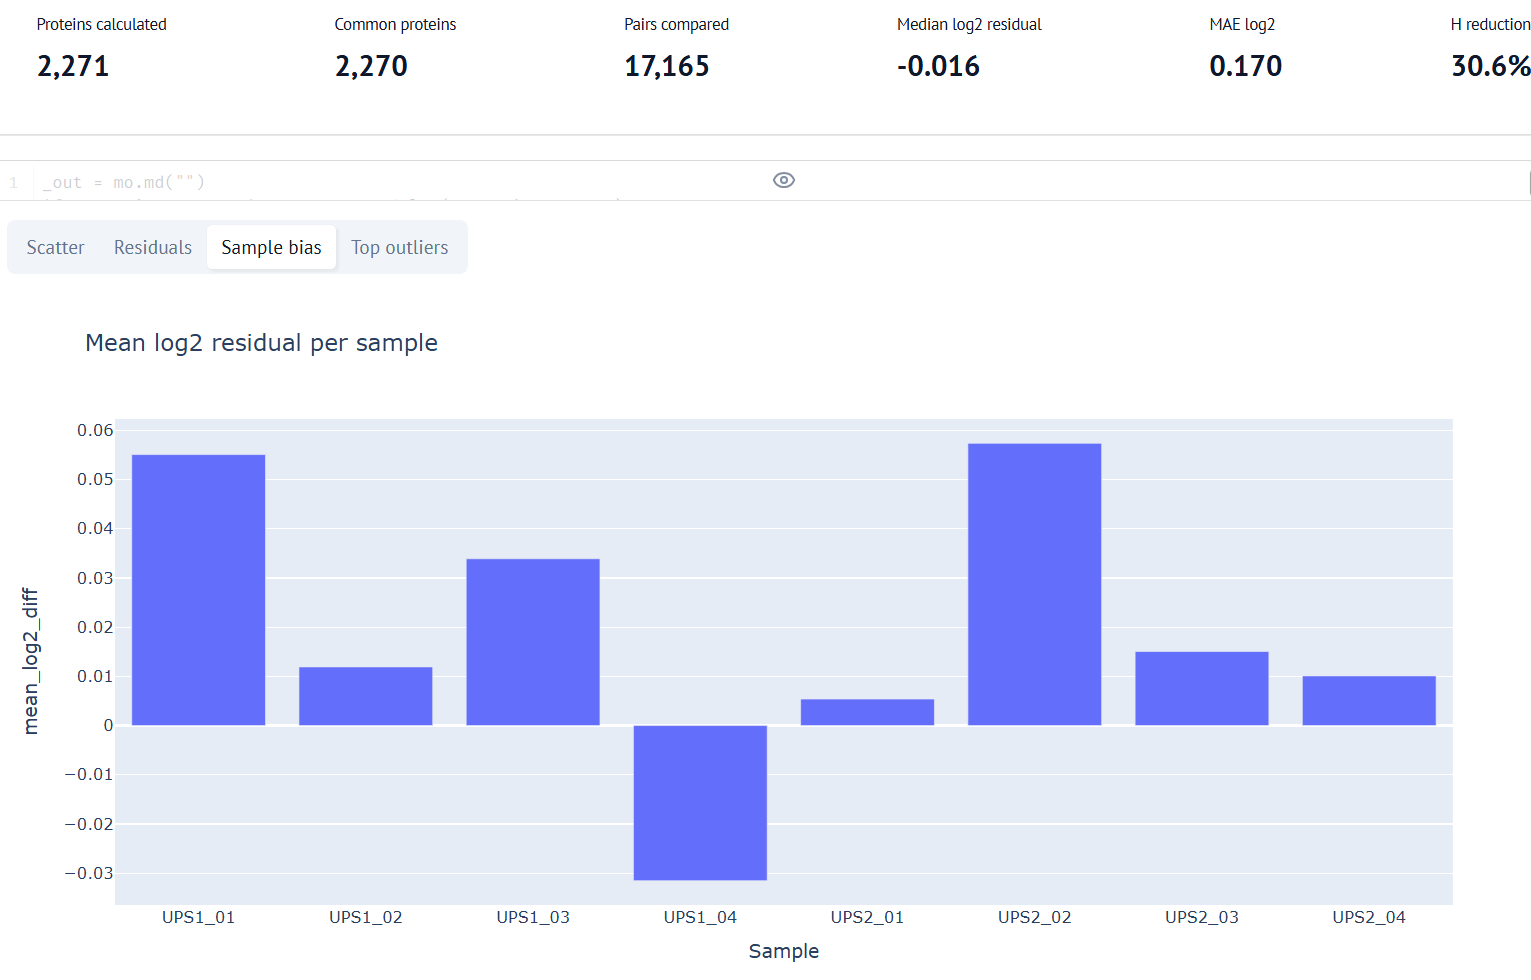
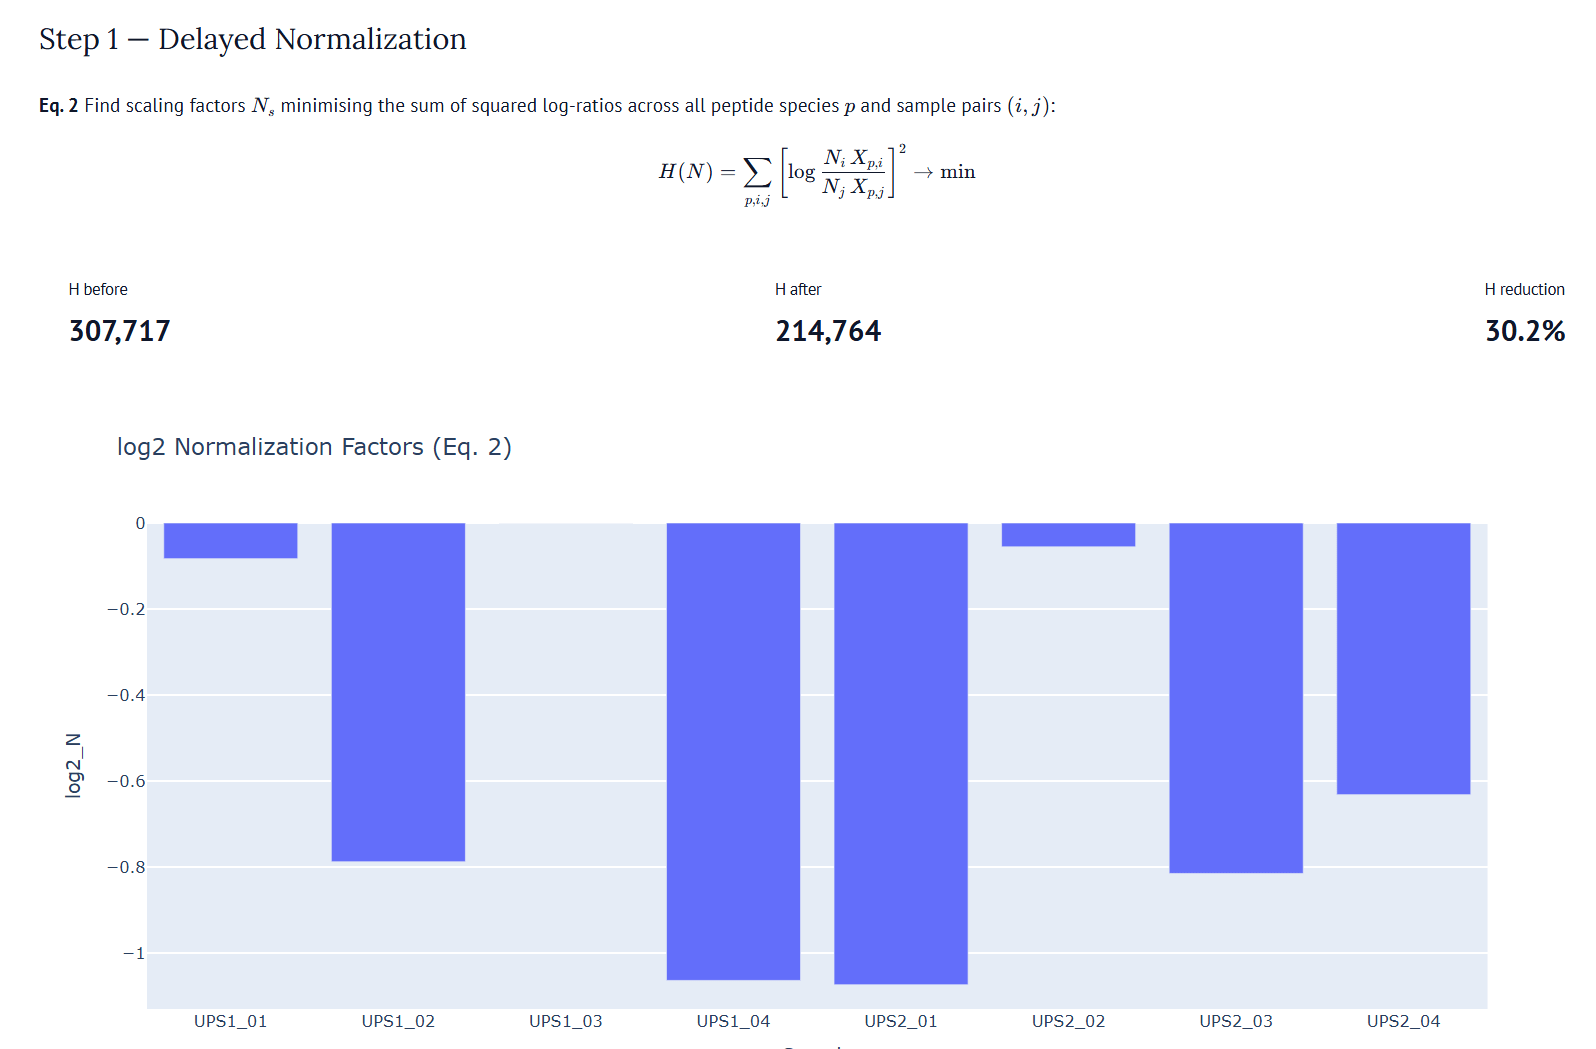
I could have generated msms/evidence.txt which also has charge information using provided raw data (look for *UPS*.raw?) which might show a little more impro? Or maybe something missing in the second step where it runs delayed normalization which tries to find global per-sample log-scale correction factors that minimize the total squared log-ratio variance across ALL peptide species simultaneously
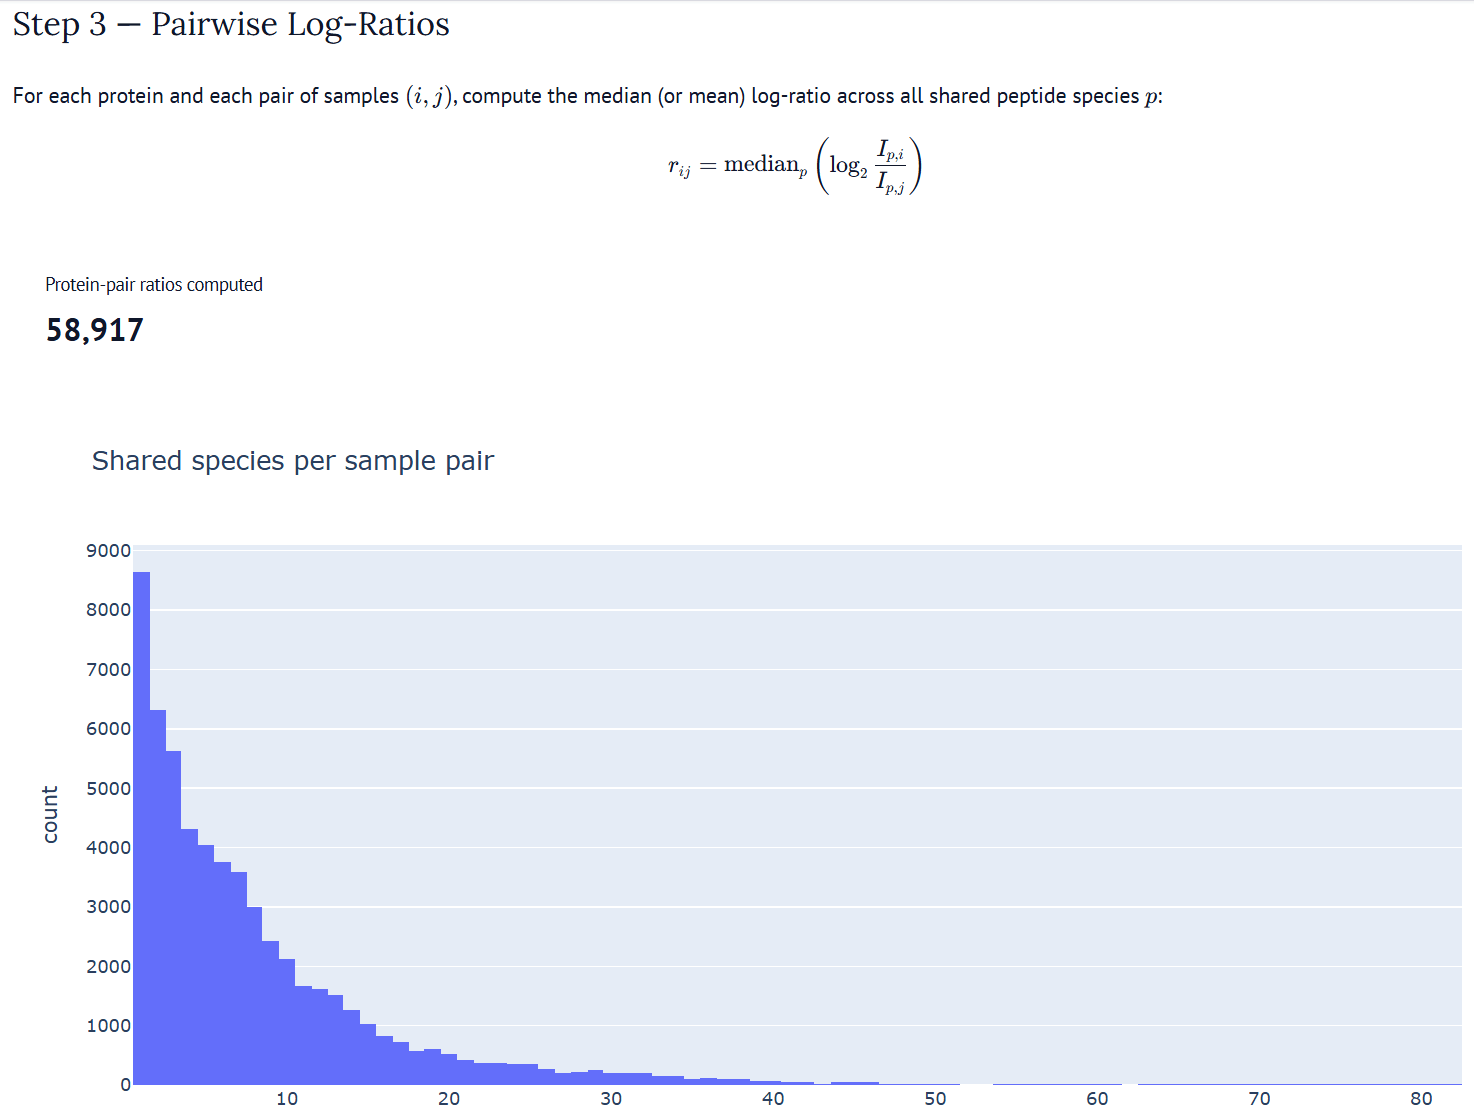
Or in third step where for each protein it computes pairwise log₂ ratios between samples using the median across shared species?
Or in the fourth step where it does profile reconstruction which solves least-squares system per protein to find LFQ intensities
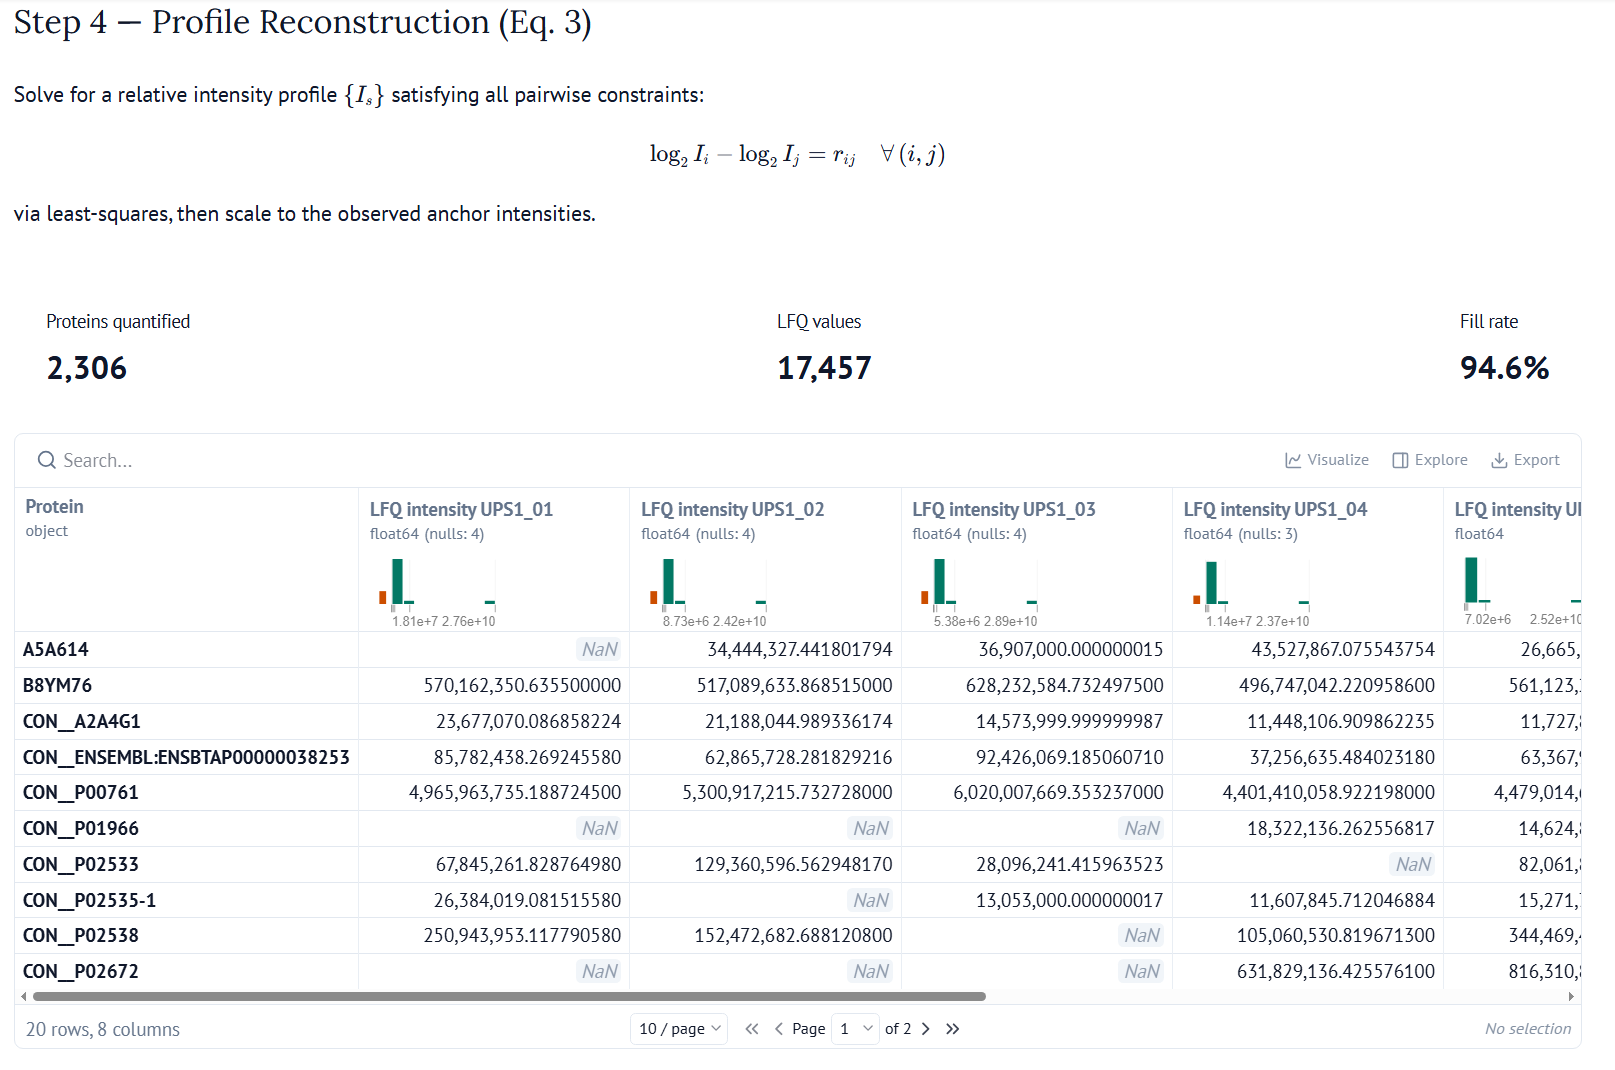
consistent with those ratios (minimizing norm here),then scales to an anchor (using sample with overall max intensity here)
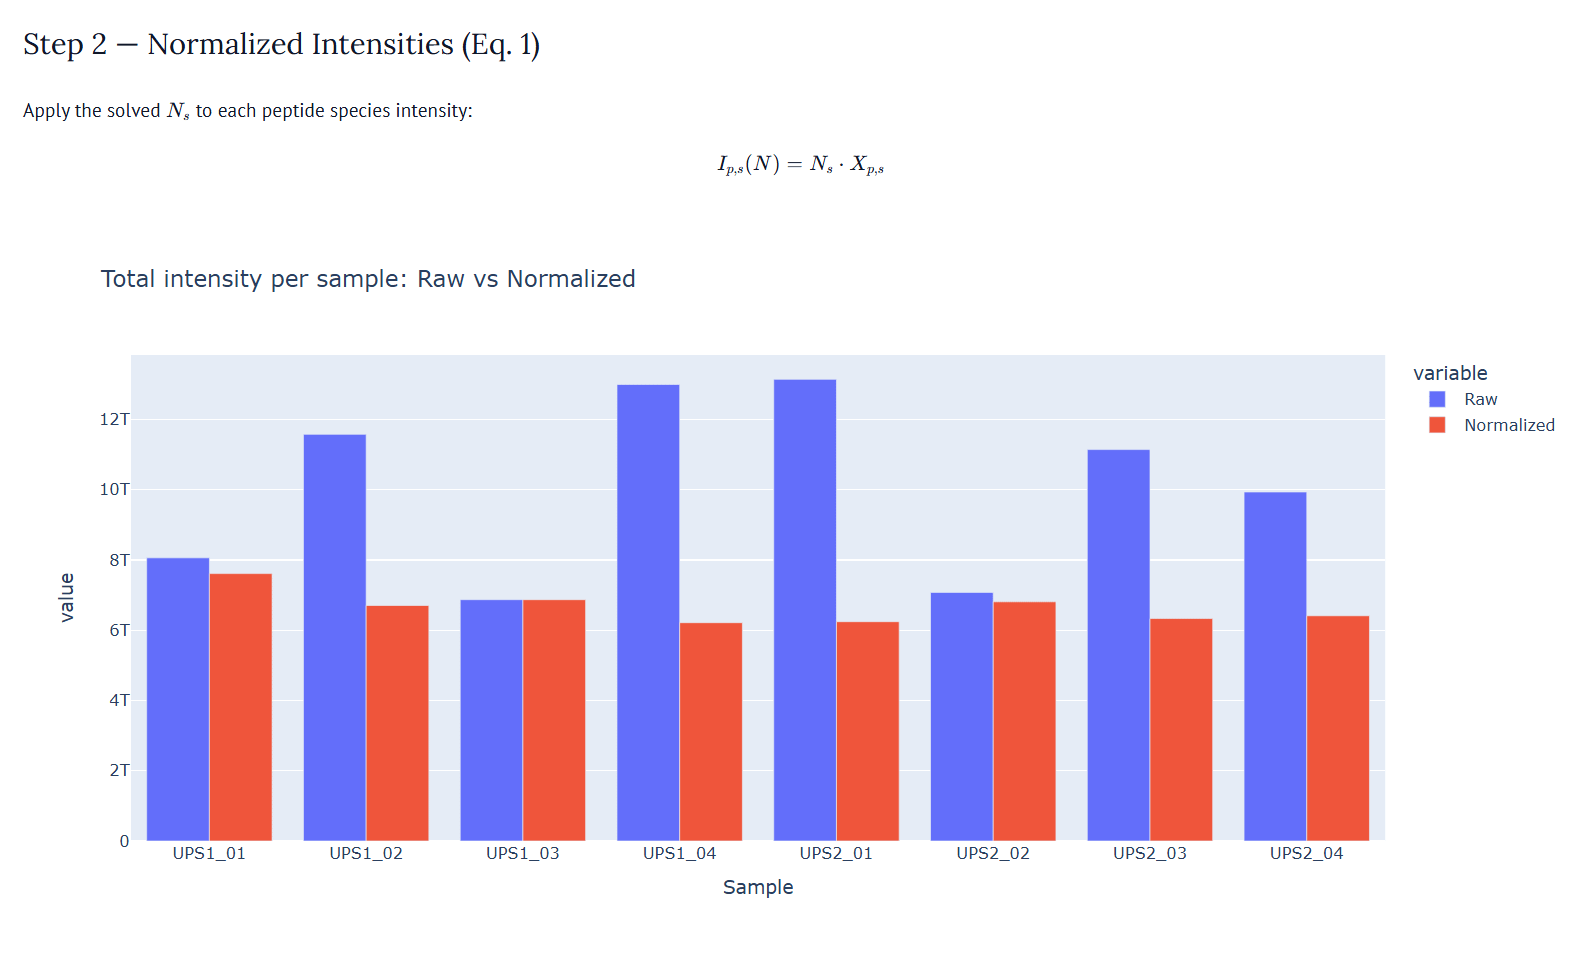
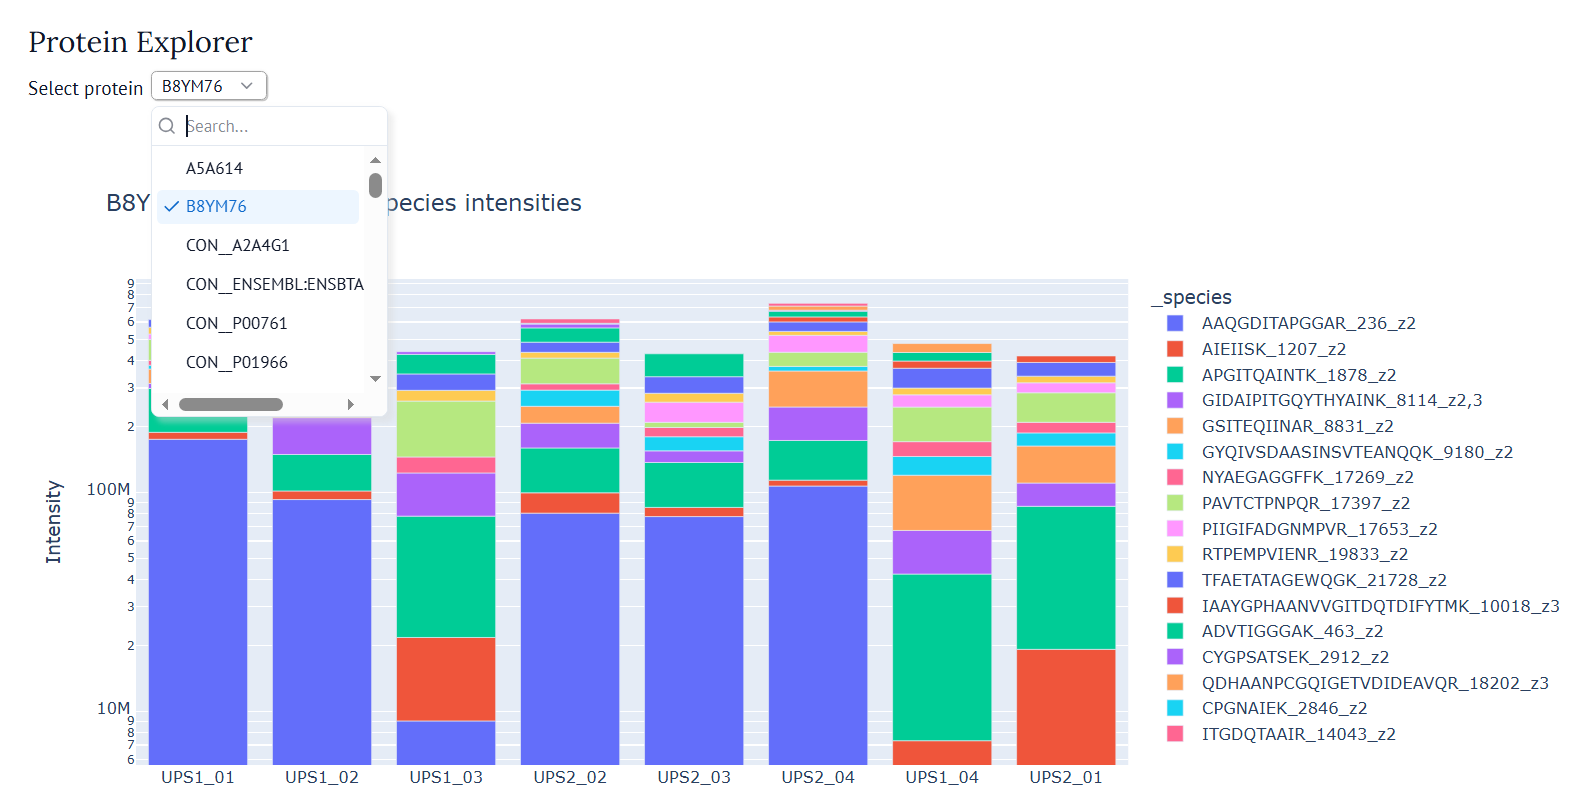
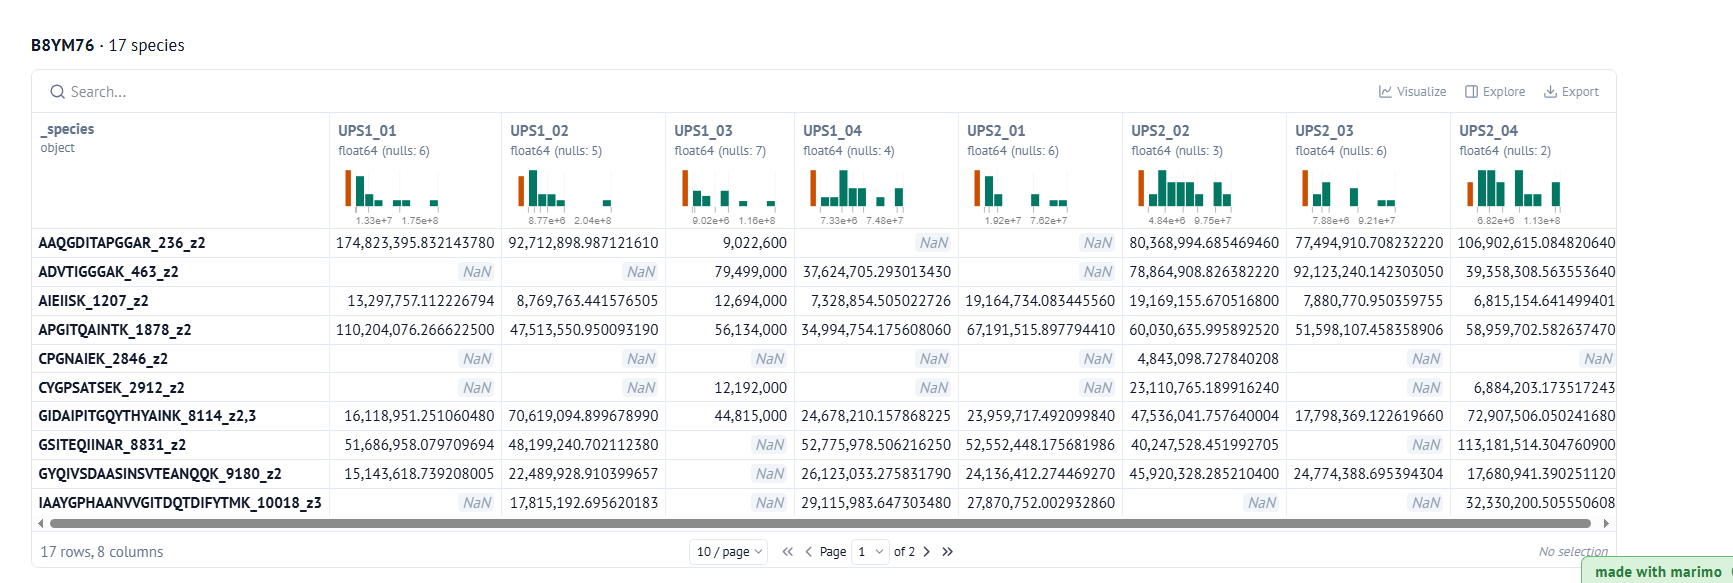
So far the notebook only understands (mod)peptides.txt (required) and proteinGroups.txt (optional, for validation). It auto-detects protein, sequence, modification, and charge columns plus all intensity columns and samples. Everything updates reactively, change a parameter and the whole pipeline reruns, courtesy marimo 👌 A live protein explorer sits between Step 2 and Step 3. Pick any protein from the dropdown and see the normalized intensities of all its peptide species across samples. Great for sanity-checking individual proteins and spotting outlier species. It appears as soon as peptides.txt loads, even before normalization completes, showing raw species intensities and upgrading to “normalized” once the solver finishes 🤞
Parameters Section
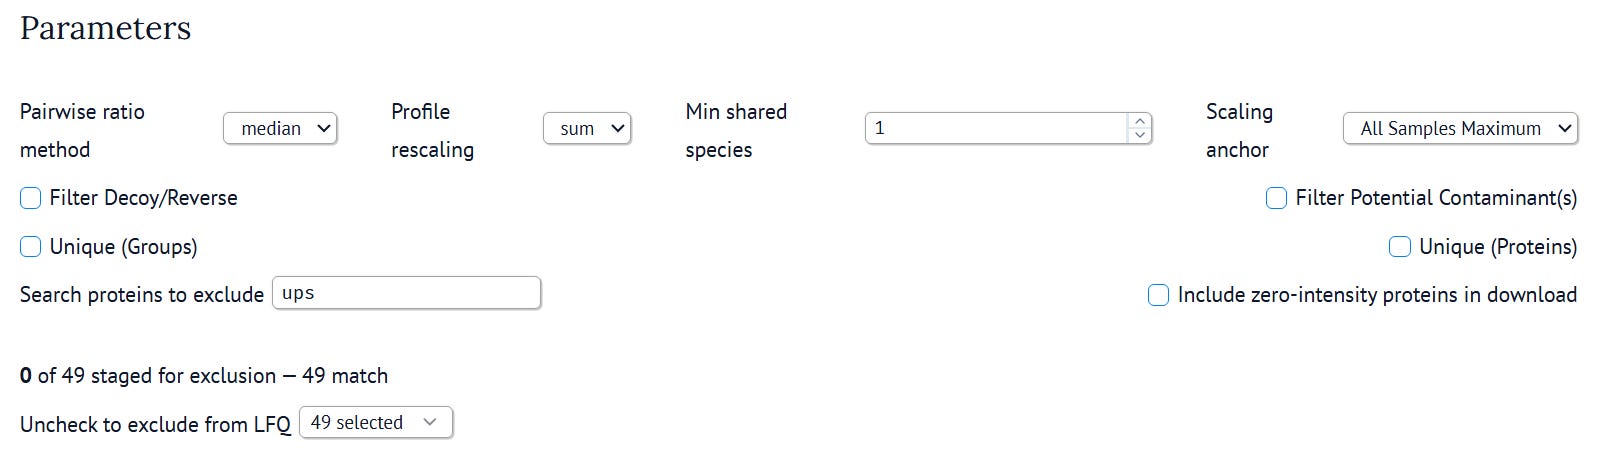
All the knobs in one place
Ratio method: median (default) or mean
Profile rescaling: sum (default) or max of normalized species intensities as the anchor
Min shared species: minimum species that must be shared between two samples for a pairwise ratio to count
Scaling anchor: which sample (or all-samples max/average/median) to scale LFQ values to
Filter Decoy/Reverse and Filter Potential Contaminant(s): exclude flagged rows before any calculations
Unique (Groups) / Unique (Proteins): restrict to only peptides unique to a protein group or protein
Search proteins to exclude: type a substring and uncheck matching proteins from the LFQ calculation useful for removing specific contaminants by name, spike-ins, decoys?
Include zero-intensity proteins: adds back proteins with no quantifiable signal as all-NaN rows, for matching proteinGroups.txt row counts
Every parameter change re-runs the full pipeline reactively. The download button generates a filename which encodes all active settings like
maxLFQmo_ratio-median_scale-sum_min-1_anchor-AllSamplesMaximum_decoy-54_cont-223_excl-0_ug-no_up-no_zi-no.tsvso you always know exactly what was computed 😊
Zero-Intensity Proteins
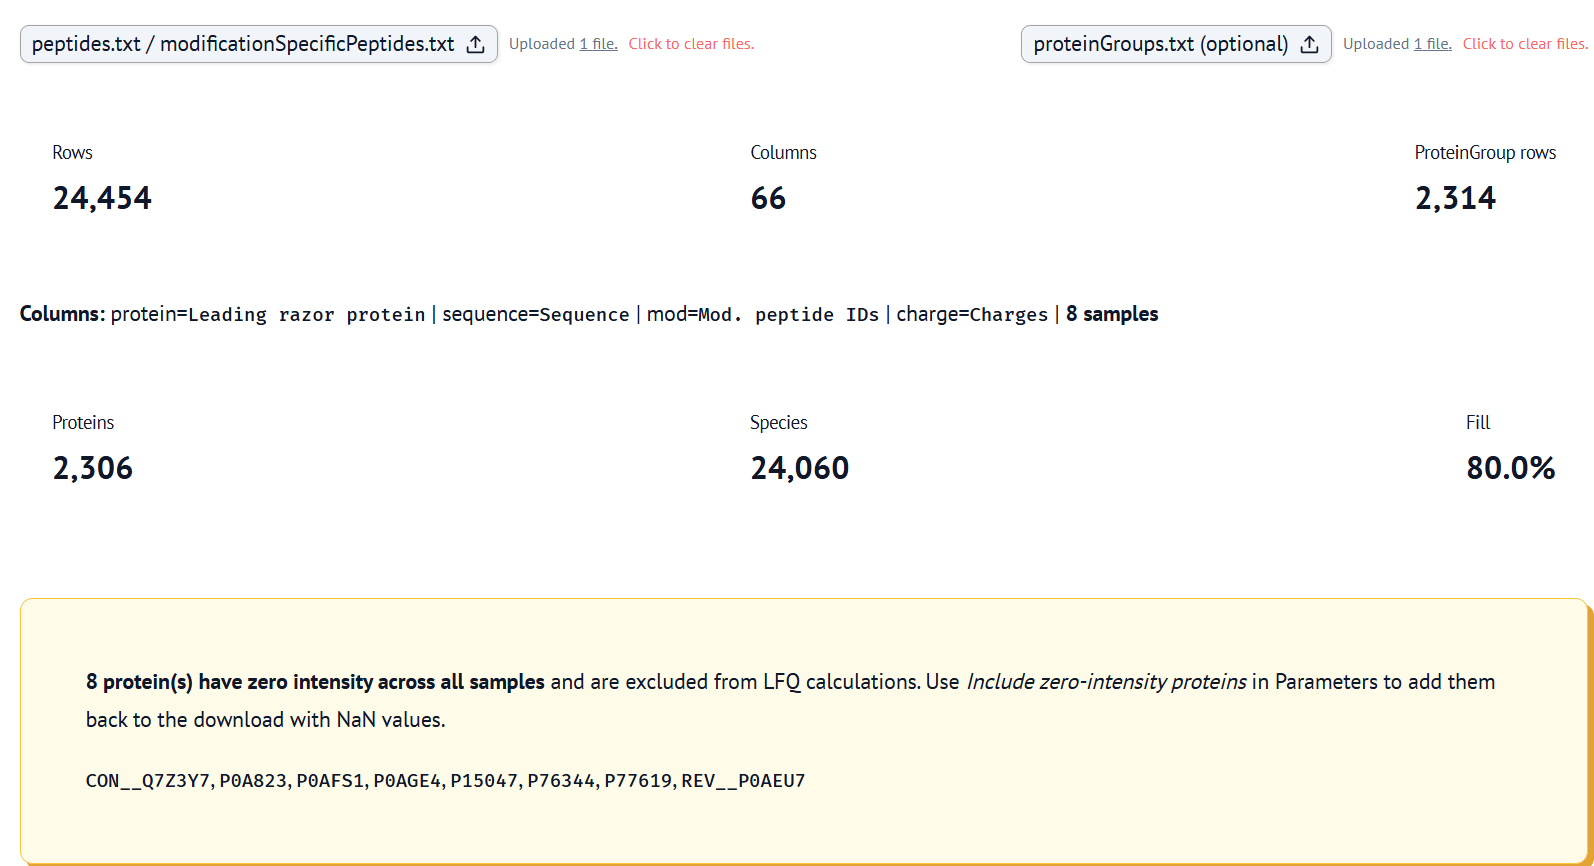
A callout appears when proteins have zero intensity across all their peptide rows. MaxQuant identified them (they appear in proteinGroups.txt) but couldn’t quantify them as there is no signal to work with. They get dropped from the LFQ calculation by default. The zi-yes filename flag and the Include checkbox add them back as all-NaN rows if you need complete row correspondence with MaxQuant’s output.
Export

Downloads a TSV with LFQ intensity <sample> columns (the MaxLFQ values) and Raw intensity <sample> columns (sum of raw species intensities per protein, computed from the same filtered species matrix so all filters are respected). The filename updates automatically with every parameter change 👌
Comparing to iq
Now for the mystical part. The R package iq is a well-tested, C++-optimised reimplementation of MaxLFQ widely used in the proteomics community and embedded in DIA-NN’s PG.MaxLFQ output. So i thought Running fast_MaxLFQ from iq on the same peptides.txt (R script) should give similar results.
wget https://raw.githubusercontent.com/animesh/scripts/refs/heads/master/testIQ.r
Rscript testIQ.r
Warning message:
package ‘iq’ was built under R version 4.5.3
nrow = 153688, # proteins = 2270, # samples = 8
Using 63 threads...
1%
Completed.
    Sample     N   Pearson  Spearman      MAE     RMSE      Bias MedianDiff
    <char> <int>     <num>     <num>    <num>    <num>     <num>      <num>
1: UPS1_01  2096 0.8697963 0.8829599 3.018133 3.381551 -3.000392  -3.121918
2: UPS1_02  2178 0.8888601 0.9037955 2.370045 2.753576 -2.249254  -2.384716
3: UPS1_03  2122 0.8848367 0.8997486 3.094389 3.455609 -3.078210  -3.188314
4: UPS1_04  2198 0.9012102 0.9154768 2.173133 2.551350 -1.997335  -2.142336
5: UPS2_01  2187 0.8948563 0.9093898 2.160796 2.539212 -1.948812  -2.102107
6: UPS2_02  2105 0.8811336 0.8923041 3.034505 3.405447 -3.007701  -3.132560
7: UPS2_03  2152 0.8934034 0.9075462 2.373333 2.754512 -2.225961  -2.365659
8: UPS2_04  2153 0.8941806 0.9065267 2.528791 2.915838 -2.424373  -2.556860
2,270 proteins normalized with log2~3 lower values cf. proteinGroups.txt/MaxQuant’s LFQ values BUT it gets worse as trying to replicate Figure-6A of MaxLFQ

wget https://raw.githubusercontent.com/animesh/scripts/refs/heads/master/compareIQ.py
python compareIQ.py
--- Metrics: MAE, Pearson, Spearman (vs MaxQuant) for UPS Proteins ---
IQ vs MQ (UPS1_01): MAE=3.4214 | Pearson=0.2966
IQ vs MQ (UPS1_02): MAE=2.6594 | Pearson=0.2427
IQ vs MQ (UPS1_03): MAE=3.5863 | Pearson=0.2791
IQ vs MQ (UPS1_04): MAE=2.5991 | Pearson=0.3078
MO vs MQ (UPS1_01): MAE=0.2518 | Pearson=0.9658
MO vs MQ (UPS1_02): MAE=0.1737 | Pearson=0.9815
MO vs MQ (UPS1_03): MAE=0.1761 | Pearson=0.9847
MO vs MQ (UPS1_04): MAE=0.1896 | Pearson=0.9727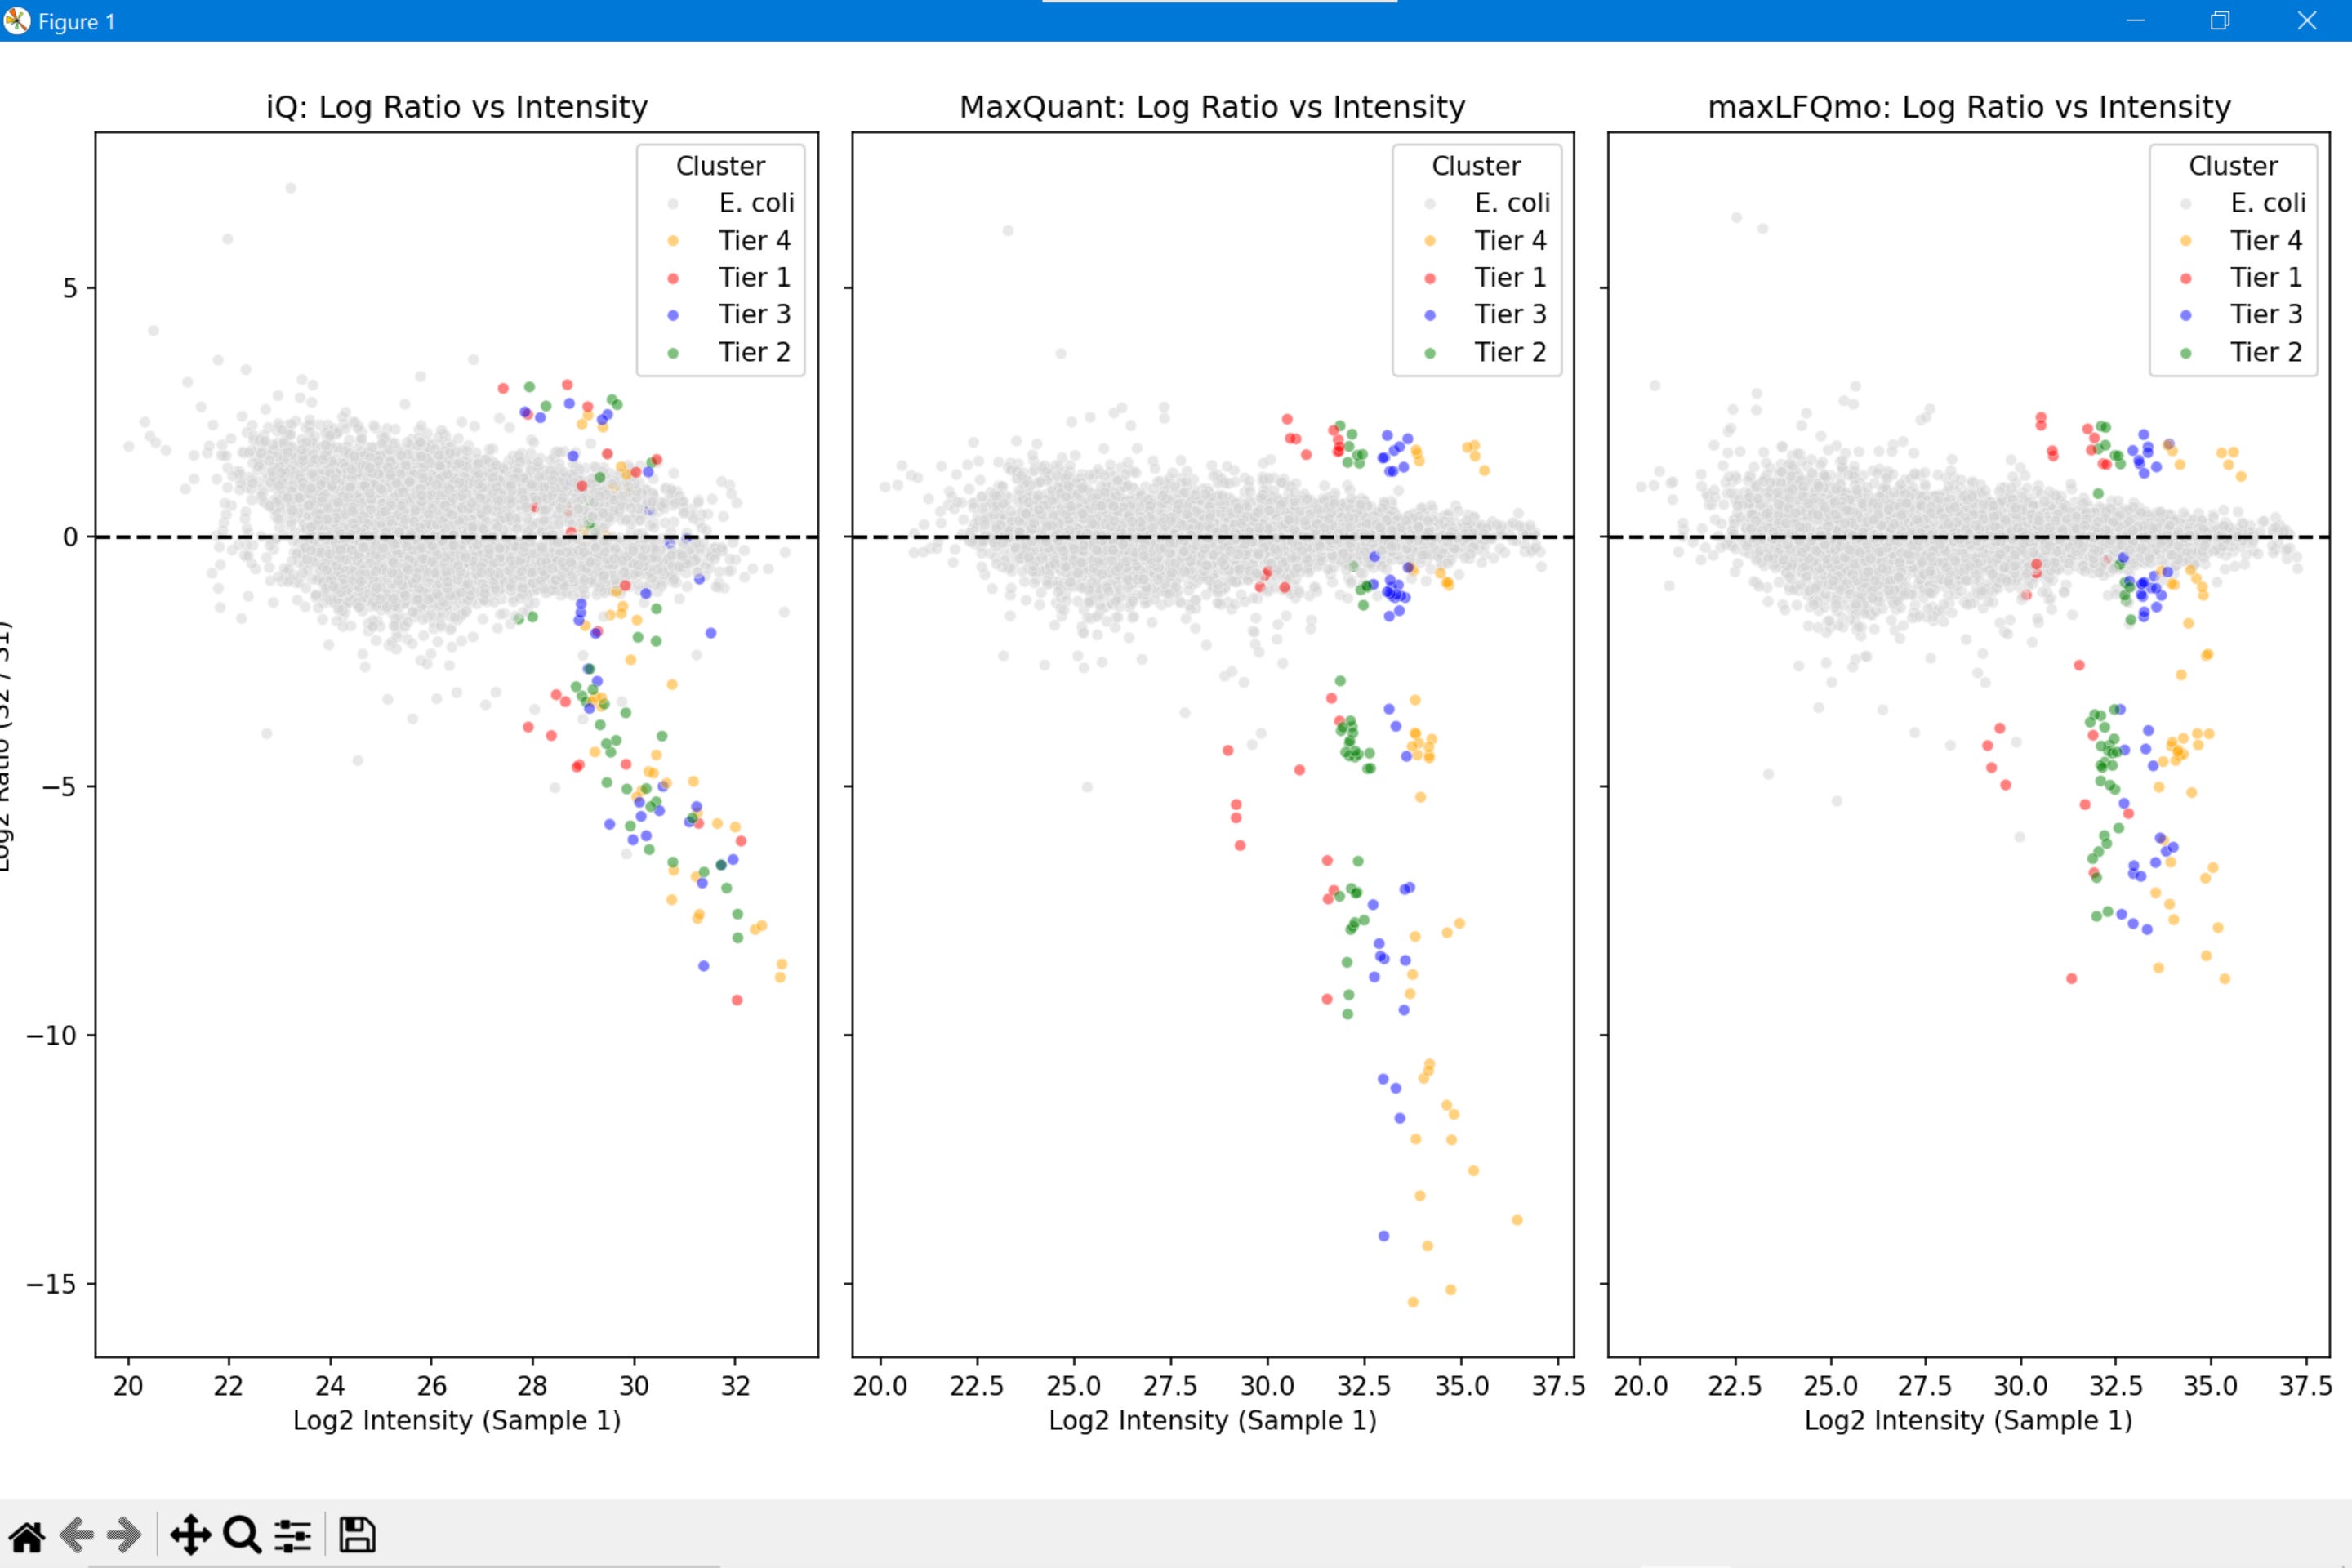
spike-ins looks scrambled for iq?
What is going on?
Looks like iQ’s fast_MaxLFQ appears to skip or apply probably different version of this final scaling. The output lives in log2-peptide-intensity space (~25–27 for a typical HeLa experiment) rather than being anchored back to the raw intensity magnitude. The proteins are correctly ranked relative to each other within a sample (r ≈ 0.89 after centering is still reasonable) but the absolute values are on a different and compressed scale.
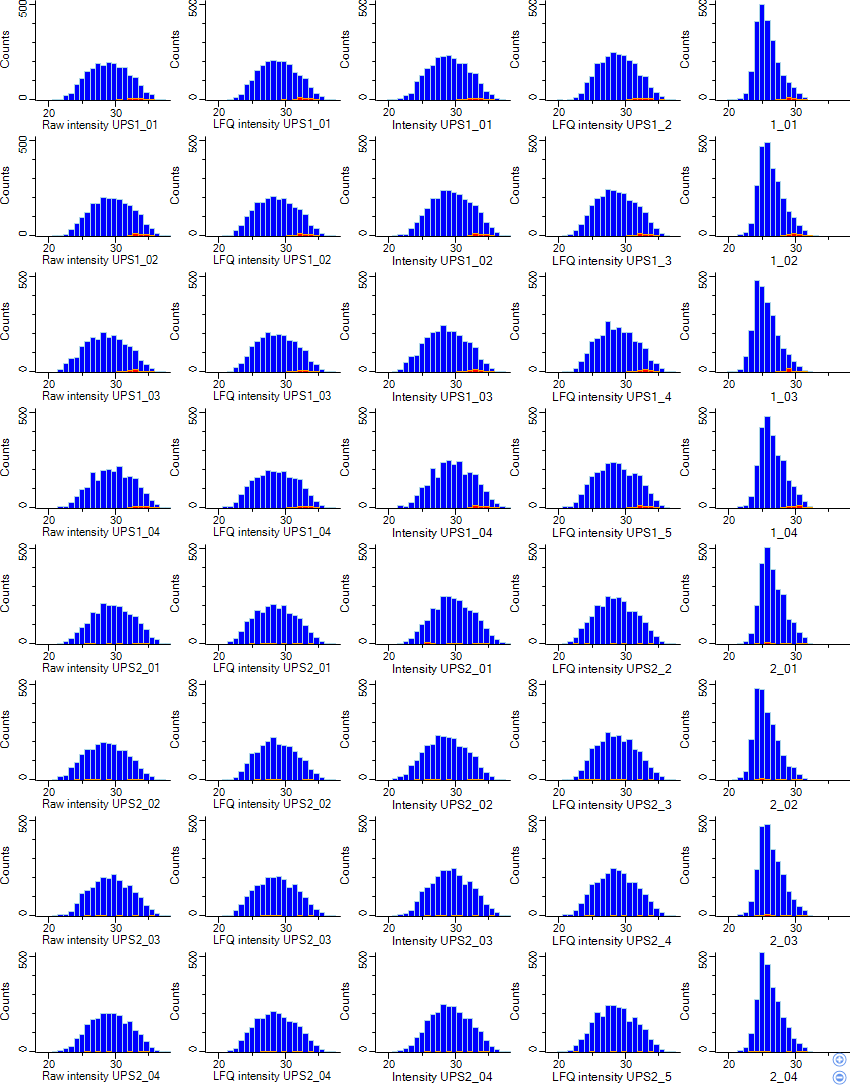
This means: iQ log2 LFQ values are not directly comparable to MaxQuant LFQ values. They shouldn’t be used interchangeably. For differential expression within iQ’s own output (fold changes between groups), they’re fine -- the relative differences are preserved. But if you’re comparing to MaxQuant numbers, or using the absolute values for anything, be careful 🤞
I guess i need to dig deeper and explore probably with marimo’s LIVE edit! This, as usual, is work in progress! Meanwhile feel free to play/break https://molab.marimo.io/github/animesh/scripts/blob/master/maxLFQmo.py/wasm 😀