
Comparing high throughput data
probably it's better to KISS first

While posting Learning LIMMA, I was wondering about something simple like when we compare groups to find differentially expressed genes / proteins / transcripts… “biomarkers”, shouldn’t we first try the simplest possible thing? Probably better to Keep It Simple, Stupid, i.e. KISS 🙂 instead of jumping almost immediately to sophisticated statistical frameworks because i think that a simple baseline often helps us understand what is actually happening.
For example, when analyzing high‑throughput quantification data like, RNA‑seq (example here) we typically go straight to tools like LIMMA, DESeq2, edgeR, etc. for analysis but what happens if we first compare results with a very simple baseline like a two‑sample t‑test? I always do it on Proteomics (example here) data. So, before jumping in the LIMMA’s proteomics version LIMPA, I wanted to see what differences appear going from t-test to LIMMA in purely simulated “random” data because we might be getting spurious signal when we start adding complexity? Are we seeing signal even in randomly generated data? Are we target-ing the signal or the noise? Let’s start with a
small reproducible experiment
The idea is simple, maybe too simple, generate relatively more “realistic” random data using log-normal distribution (defaults as seed 42, 10000 genes, 3 samples each for both groups, max-val 50 and distribution log-normal), run t-test + LIMMA on the generated data as default, and compare those results.
Step 1 — Generate synthetic data
wget https://raw.githubusercontent.com/animesh/scripts/94a7146800211761a6b356ec5ef5853298848ced/gen_input.R
Rscript gen_input.R
Step 2 — Run a simple t‑test
wget https://github.com/animesh/scripts/blob/52233eab1325bd1df91f77e20eb61af7fcd35c57/run_tTest.R
Rscript run_tTest.R
Step 3 — Run LIMMA
wget https://raw.githubusercontent.com/animesh/scripts/94a7146800211761a6b356ec5ef5853298848ced/run_limma.R
Rscript run_limma.R
Step 4 — Compare results
wget https://raw.githubusercontent.com/animesh/scripts/27bca6ecae23f01244c0fc95739441366a0047ec/compare_methods.R
Rscript compare_methods.R
What does the comparison look like?
Scatter plot of calculated p-values with simple t‑test and LIMMA (colored by average log2-Fold Change)
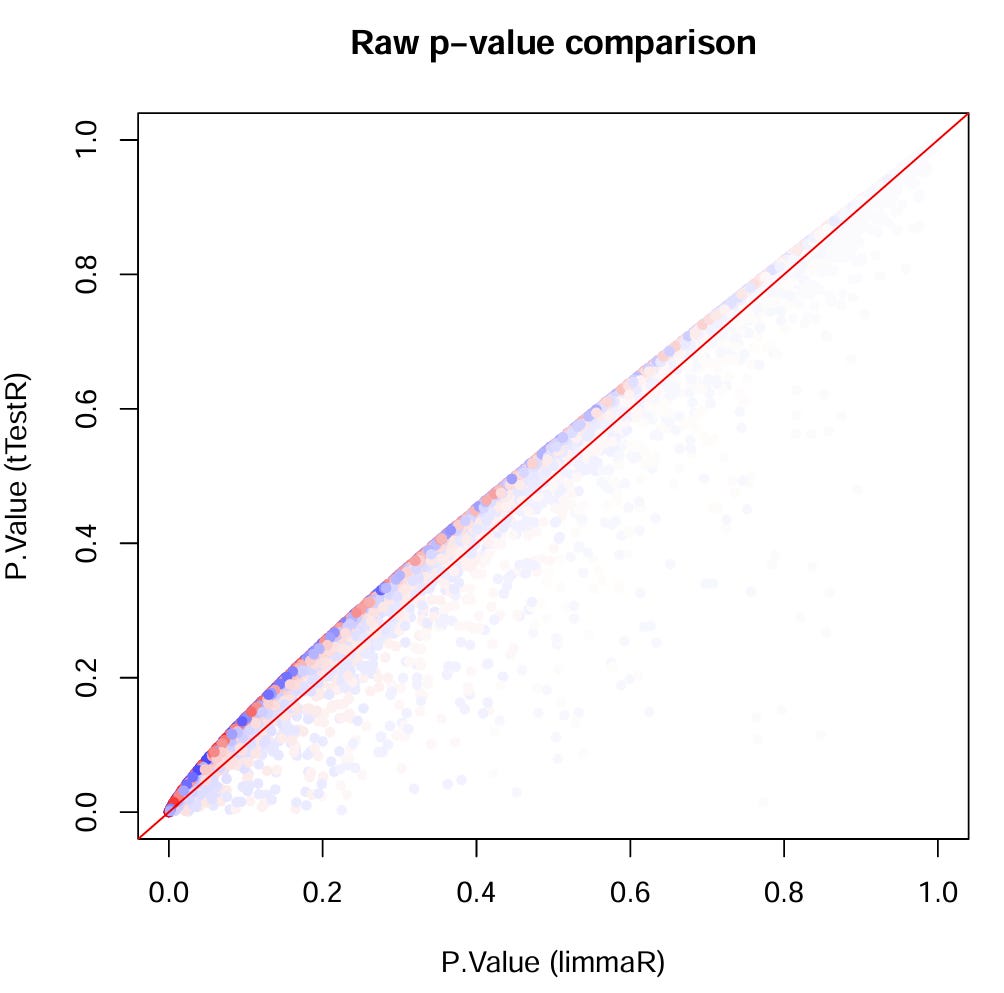
Looks like LIMMA is giving a lot of low p‑values some of which seems to survive adjusted p‑values (depending on where you draw the line of course)
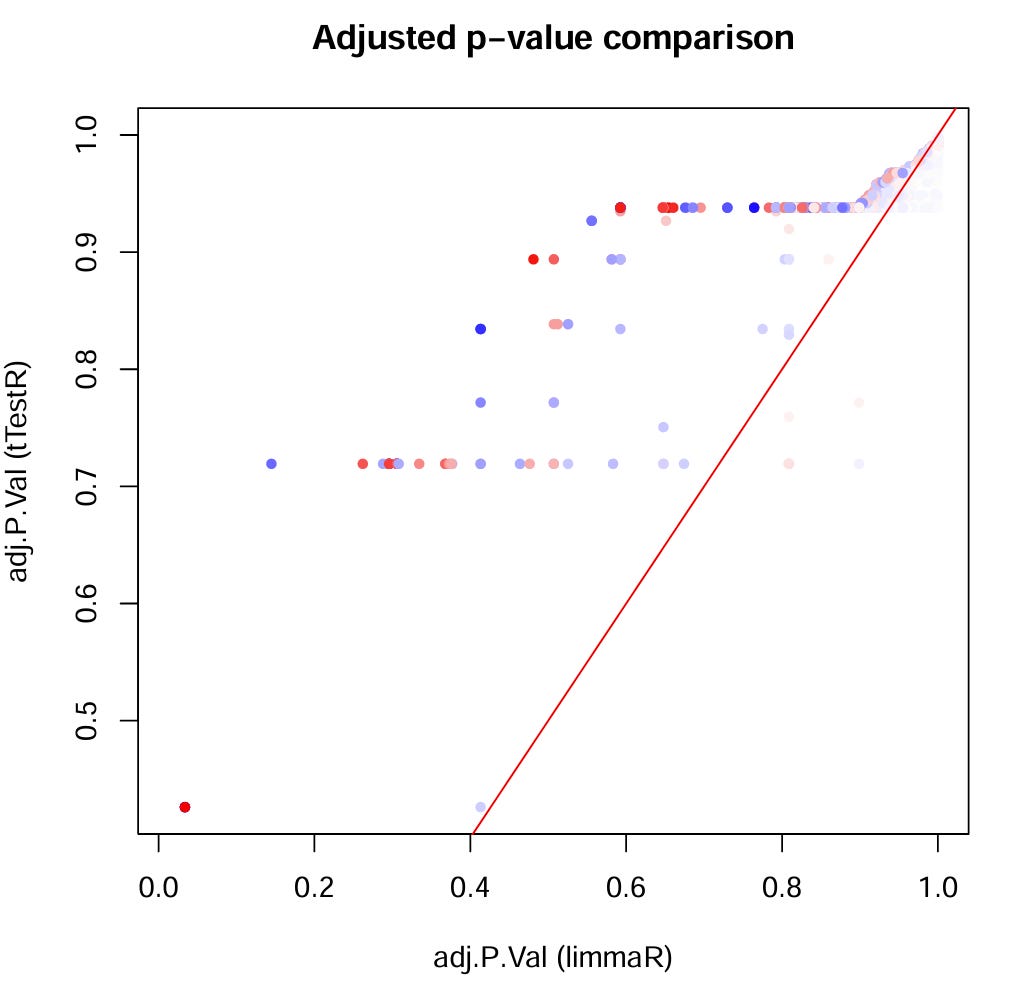
using multiple testing correction for which we rely on our good old friend the Benjamini‑Hochberg procedure to flag potential “false discoveries”?
Maybe it is not completely stupid to start with basic differential expression analysis after all, especially when we don’t yet know what the data/we are doing. Because when we don’t know where we are going… ani-road will take us there 😜
What’s next?
Since this is “simulated” data, next obvious step is to compare different seeds, distributions, sample sizes, maybe even number of genes cos panels/pull-downs quantify a lot less than 10000! Why not? Playing with these parameters is just few arguments away (check the gen_input.R code), for example, Negative binomial, high overdispersion (size=0.5), unbalanced groups?
Rscript gen_input.R 7 10000 4 2 100 nbinom 0.5Just a few parameters allow testing things like:
different random seeds?
different distributions (log‑normal vs negative binomial vs poisson?)
sample size changes / unbalanced groups?
high min/maxval/overdispersion?
…
BUT keep in mind caveats of the simulation as test/documented by Posit/AI here gen_input_tests.md
Another obvious sanity check is comparing some “real world” data like the HeLa proteomics data (details here) and randomly assigning them to two groups and comparing, randomly splitting SAME samples measure multiple times into two groups should ideally NOT produce Nobel‑prize‑winning biomarkers…but who knows 🫡
Or even more compelling/comparing the dilutions of Ecoli in backdrop of HeLa (details here) which should mark out the Ecoli proteins? Cos in that situation we actually expect positively that the E. coli proteins to stand out 🤞
As usual, feel free to play with the code(s) and fix bug 😜
Work in progress…
TBH the preprocessing could probably be improved with voom / filtering etc… simulation intentionally violates some conditions where LIMMA might be advantageous, like simulating log-normal independent observations with equal variance, then the plain t-test is almost the true model, and LIMMA’s shrinkage becomes unnecessary, not to mention
This is still a simplified simulation.
LIMMA uses empirical Bayes shrinkage to stabilize variance estimates.
RNA‑seq pipelines usually apply voom transformation.
Distributional assumptions matter (log‑normal vs negative binomial).
Real datasets often contain additional batch effects and heteroscedasticity.
Its WIP and let’s keep these in mind while we are at it, flagged by Posit AI 🙏